
Introduction
Description
Apex Recon is a Web Application Attack Surface Mapper, capable of analyzing the behavior and I/O characteristics of modern web applications and web APIs.
You can access Apex Recon via multiple interfaces, such as:
Installation
For installation instructions please refer to the installer.
System requirements
| Operating System | Architecture | RAM | Disk | CPU |
|---|---|---|---|---|
| Linux | x86 64bit | 2GB | 4GB | Multicore |
Resource constrained environments
To optimize the resources a scan may use please consult:
CLI
Command-line interface executables can be found under the bin/ directory and
at the time of writing are:
Basic, Pro
apex– Direct scanning utility.apex_reporter– Generates reports from.crf(Cuboid report file) and.aer(Apex Recon report) report files.
Scanning and reporting
To start a scan and save the report as JSON:
bin/apex https://ginandjuice.shop/ --report-save-path=report.json
Sink filter
Apex traces five kinds of sink — active,
body, header_name, header_value, and blind. The CLI logs the
first four by default and skips blind (input reaches a sink with
no observable response signal — useful for targeted recon, noisy as
a default). Hits at filtered-out sinks are skipped at trace time
and never enter the report.
Override with --sink-filter NAME (repeatable, OR-ed):
# Only exec-context findings
bin/apex https://example.com/ --sink-filter active

# Default four PLUS blind
bin/apex https://example.com/ \
    --sink-filter active --sink-filter body \
    --sink-filter header_name --sink-filter header_value \
    --sink-filter blind
The first explicit --sink-filter clears the default; subsequent
ones accumulate. The CLI prints which sinks are loaded at scan start:
[~] Recording sinks (default — pass `--sink-filter blind` to include blind hits): active, body, header_name, header_value
To run a crawl-only pass (sitemap, no entries), there is no CLI
flag yet — use the profile UI or the MCP
sinks_filter: [] shape.
MCP
1.apex_mcp_server – Starts an MCP server daemon.
Pro
1.apex_pro – Starts a Web Interface server daemon.
License utilities
apex_activateapex_editionapex_available_seatsapex_license info
MCP
Apex Recon ships a Model Context Protocol server so an AI client (Claude Desktop / Code, Cursor, Continue — anything that speaks MCP) can drive scans directly: spawn an Instance, watch its progress, fetch entries and reports, and tear it down again — over a single HTTP endpoint.
The full surface is exposed as MCP tools, prompts, and
resources, and described to the client via the protocol’s own
discovery calls (tools/list, prompts/list, resources/list).
Whatever the model sees in its context is exactly what the
surface advertises — the descriptions are the docs.
This page is the canonical reference. It is the only document an AI needs to understand and drive the surface end to end; everything else in this section either complements it or provides language bindings.
Table of contents
- Server
- Endpoint
- Tools
- Prompts
- Resources
- Options reference
- Auth
- Self-discovery flow
- Status semantics
- Polling cadence
- Instance lifetime
- Error idiom
- Options trivia
- Conventions baked into the descriptions
- Things the protocol doesn’t expose yet
- Connecting an MCP client
- End-to-end example — curl
Server
To start the MCP server:
bin/apex_mcp_server
To see CLI options:
bin/apex_mcp_server -h
The transport is Streamable HTTP — every call is a JSON-RPC
POST, optionally upgraded to a Server-Sent Events stream by the
server. Authentication is configured in-application (see Auth below);
there are no --username / --password flags.
Endpoint
A single URL — http://<host>:<port>/mcp. There is no per-instance
sub-route; instance scoping is done by passing instance_id as an
argument to every per-scan tool. One MCP server, one session per client.
serverInfo advertises { name: "apex", version: "<release>" },
matching the running build. The brand and version are picked up
automatically — there’s nothing to configure on the CLI.
Tools
The server flattens framework + scan tools into one tools/list
response. Every tool that returns structured data declares an
outputSchema; the response carries both content[0].text
(JSON-encoded, for clients that don’t speak typed outputs) and
structuredContent matching the schema (for clients that do).
Framework tools
| Tool | Required | Optional | Returns (structuredContent) |
|---|---|---|---|
list_instances | — | — | { instances: { <id>: { url } } } |
spawn_instance | — | options, start=true | { instance_id, url } |
kill_instance | instance_id | — | { killed: <id> } |
list_plugins | — | — | { plugins: [{ shortname, name, description, default, options[] }] } |
spawn_instance.options is forwarded to instance.run(...). To
spawn an Instance without running anything, pass start: false;
passing options: {} does not skip the run.
list_plugins enumerates the plugin catalog — shortname + name +
description + per-plugin config schema. Plugins flagged default: true
auto-load on every scan; you can name additional ones in
options.plugins (array form: ["autologin"]) or pass config via the
hash form ({"autologin": {"url": "...", "params": "..."}}). The list
is filtered to only the plugins Apex actually accepts — output-streaming
(live, webhook_notify, email_notify), AI-augmentation
(openai, claude), and the in-process trap-doors (exec, script)
never appear because the application would reject them at validation.
For the full options surface, read the
apex://options/reference resource (covered below) or
the inlined Options reference further down this
page.
Per-scan tools
Every per-scan tool requires instance_id. scan_progress is
incremental via a caller-chosen session token — pass any string
(typically a UUID) and the engine returns only items not previously
emitted under that token. Reuse the same token across polls for the
same logical view; pick a fresh one to start fresh. Without a token
every poll returns the full set. The standalone scan_sitemap /
scan_entries / scan_errors tools are direct one-shot fetches and
take their own delta args (*_seen / *_since).
| Tool | Required | Optional | Returns |
|---|---|---|---|
scan_progress | instance_id | session, without_errors, without_sitemap, without_statistics | { status, running, seed, statistics?, entries?, errors?, sitemap?, messages } |
scan_report | instance_id | — | { entries, sitemap, statistics } |
scan_sitemap | instance_id | sitemap_since=0 | { sitemap: { <url>: <code> } } |
scan_entries | instance_id | entries_seen=[] | { entries: { <digest>: <entry> } } |
scan_errors | instance_id | errors_since=0 | { errors: [string] } |
scan_pause | instance_id | — | { status: 'paused' } |
scan_resume | instance_id | — | { status: 'resumed' } |
scan_abort | instance_id | — | { status: 'aborted' } |
Entry digests
Entry digest values are the keys of the returned entries hash
(NOT a field nested inside the value) — 32-bit integers. scan_entries
accepts the digest array as integers or numeric strings (some JSON-RPC
clients stringify large numbers); the server coerces. If you ever see
the same entry stream back unchanged after passing it as entries_seen,
a stringified-vs-int mismatch is the first thing to check.
Prompts
| Prompt | Required | Description |
|---|---|---|
quick_scan(url) | url | Canned operator workflow for the bounded smoke test — expands into a 6-step user message that walks the AI through reading the options reference, building options from the quick-scan preset (scope.page_limit: 50 baked in), spawn_instance, polling scan_progress every 5 s using deltas, fetching scan_entries when status reaches done, and kill_instance-ing afterwards. Optional args: page_limit (override the cap), authorized_by, extra_options. |
full_scan(url) | url | Same shape as quick_scan minus the 50-page cap — drives a complete recon using the full-scan preset. Use when you want a thorough run and accept hours of polling. Optional args: authorized_by, extra_options. |
The expanded prompt body references resources by URI so the model has a clear pull path for the data — it doesn’t need to memorise option names.
Resources
| URI | Mime | Contents |
|---|---|---|
apex://glossary | text/markdown | Domain terms (entry, digest, sink, mutation, action, platforms, status, sitemap, statistics). Read once before driving a scan. |
apex://options/reference | text/markdown | Concrete keys for spawn_instance.options (url, scope, audit, http, dom, authorized_by, sinks_filter). Apex auto-loads its sink-trace checks — no checks key. |
apex://option-presets/quick-scan | application/json | JSON template — every audit element traced, the four-kind sinks_filter default (every sink except blind), scope.page_limit: 50 so a real-site smoke test finishes in minutes. Bump / drop the cap (or switch to full-scan) for a longer recon. |
apex://option-presets/full-scan | application/json | Same shape as quick-scan minus the page cap — uncapped recon. Use when you want a complete run and accept a long wait. |
apex://how-to/optimize-scans | text/markdown | How to dial spawn_instance.options for a slow target, tight RAM, runaway crawls, JS-heavy apps, or finding-class triage. MCP-flavoured port of How to ▸ Optimize scans. |
apex://how-to/maintain-a-valid-session | text/markdown | How to authenticate against a target behind a login wall — login_form, login_script, or external cookie-jar paths. MCP-flavoured port of How to ▸ Maintain a valid session. |
Quick-scan preset:
{
  "url":          "<TARGET URL>",
  "audit":        { "elements": ["links","forms","cookies","headers","ui_inputs","ui_forms","jsons","xmls"] },
  "sinks_filter": ["active","body","header_name","header_value"],
  "scope":        { "page_limit": 50 }
}
Full-scan preset (same minus scope):
{
  "url":          "<TARGET URL>",
  "audit":        { "elements": ["links","forms","cookies","headers","ui_inputs","ui_forms","jsons","xmls"] },
  "sinks_filter": ["active","body","header_name","header_value"]
}
Pulled in-band, this gives an AI client everything it needs to
schematise spawn_instance.options without leaving the protocol.
Options reference
Same content is served at
apex://options/referenceover MCP — single source of truth for both surfaces.
The full option surface accepted by spawn_instance.options
(over MCP). Hash, all keys optional.
The bare engine defaults leave every audit element OFF; only
bin/apex_scan (and the option presets) enable them. If you
build options from scratch, ship at least url and
audit.elements (or per-element booleans), or use
apex://option-presets/quick-scan.
Apex auto-loads its sink-trace checks — there is no checks
key. Configure recording scope with sinks_filter (see below).
Wire shape
This is what gets sent as spawn_instance.options over MCP — a
single nested JSON object, all groups optional, every leaf
documented further down. Each top-level key is its own JSON
object (audit, scope, http, dom, device, input,
session, timeout); the top-level scalars (url,
authorized_by, sinks_filter, no_fingerprinting) sit
alongside.
{
  "url":           "http://example.com/",
  "sinks_filter":  ["active","body","header_name","header_value"],
  "authorized_by": "[email protected]",
  "no_fingerprinting": false,

  "audit": {
    "elements":             ["links","forms","cookies","headers","ui_inputs","ui_forms","jsons","xmls"],
    "link_templates":       [],
    "parameter_values":     true,
    "parameter_names":      false,
    "with_raw_payloads":    false,
    "with_extra_parameter": false,
    "with_both_http_methods": false,
    "cookies_extensively":  false,
    "mode":                 "moderate",
    "exclude_vector_patterns": [],
    "include_vector_patterns": []
  },

  "scope": {
    "page_limit":                  50,
    "depth_limit":                 10,
    "directory_depth_limit":       10,
    "dom_depth_limit":             4,
    "dom_event_limit":             500,
    "dom_event_inheritance_limit": 500,
    "include_subdomains":          false,
    "https_only":                  false,
    "include_path_patterns":       [],
    "exclude_path_patterns":       [],
    "exclude_content_patterns":    [],
    "exclude_file_extensions":     ["gif","mp4","pdf","js","css"],
    "exclude_binaries":            false,
    "restrict_paths":              [],
    "extend_paths":                [],
    "redundant_path_patterns":     {},
    "auto_redundant_paths":        15,
    "url_rewrites":                {}
  },

  "http": {
    "request_concurrency":     10,
    "request_queue_size":      50,
    "request_timeout":         20000,
    "request_redirect_limit":  5,
    "response_max_size":       500000,
    "request_headers":         {},
    "cookies":                 {},
    "cookie_jar_filepath":     "/path/to/cookies.txt",
    "cookie_string":           "name=value; Path=/",
    "authentication_username": "user",
    "authentication_password": "pass",
    "authentication_type":     "auto",
    "proxy":                   "host:port",
    "proxy_host":              "host",
    "proxy_port":              8080,
    "proxy_username":          "user",
    "proxy_password":          "pass",
    "proxy_type":              "auto",
    "ssl_verify_peer":         false,
    "ssl_verify_host":         false,
    "ssl_certificate_filepath":"/path/to/cert.pem",
    "ssl_certificate_type":    "pem",
    "ssl_key_filepath":        "/path/to/key.pem",
    "ssl_key_type":            "pem",
    "ssl_key_password":        "secret",
    "ssl_ca_filepath":         "/path/to/ca.pem",
    "ssl_ca_directory":        "/path/to/ca-dir/",
    "ssl_version":             "tlsv1_3"
  },

  "dom": {
    "engine":              "chrome",
    "pool_size":           4,
    "job_timeout":         120,
    "worker_time_to_live": 1000,
    "wait_for_timers":     false,
    "local_storage":       {},
    "session_storage":     {},
    "wait_for_elements":   {}
  },

  "device": {
    "visible":     false,
    "width":       1600,
    "height":      1200,
    "user_agent":  "...",
    "pixel_ratio": 1.0,
    "touch":       false
  },

  "input": {
    "values":           {},
    "default_values":   {},
    "without_defaults": false,
    "force":            false
  },

  "session": {
    "check_url":     "https://example.com/account",
    "check_pattern": "Logout"
  },

  "timeout": {
    "duration": 3600,
    "suspend":  false
  }
}
In the per-key sections below, group.key is shorthand for the
JSON path { "group": { "key": ... } } — audit.elements
means the elements field of the audit object, not a literal
key called audit.elements.
Table of contents
- Top-level
audit— what the engine tracesscope— crawl boundsscope.page_limitscope.depth_limit/directory_depth_limitscope.dom_depth_limit/dom_event_limit/dom_event_inheritance_limitscope.include_subdomains/https_onlyscope.include_path_patterns/exclude_path_patterns/exclude_content_patternsscope.exclude_file_extensions/exclude_binariesscope.restrict_paths/extend_pathsscope.redundant_path_patterns/auto_redundant_pathsscope.url_rewrites
http— HTTP client tuningdom— browser cluster + DOM crawldevice— viewport / identityinput— auto-fill rulessession— login-session monitoringtimeout— wall-clock cap
Top-level
url
(string, required for a real scan)
The target. Anything reachable over HTTP(S). Required for any
spawn_instance with start: true; the only spawn path where it
can be omitted is start: false (an idle instance set up to be
configured later).
{ "url": "http://example.com/" }
sinks_filter
(string[] | null, default: server applies a four-kind whitelist)
Apex-level recording whitelist. Only hits at sinks in this list
end up in @entries / the report; everything else is dropped at
trace time. Allowed values: active, body, blind,
header_name, header_value.
Four states the operator can express:
- omit the key — MCP server applies the default whitelist
["active", "body", "header_name", "header_value"](every sink kind exceptblind). Mirrors theapex_scanCLI default. null— no filter, log every sink kind includingblind.[](empty array) — log NOTHING. The engine still crawls and produces a sitemap; no entries get recorded. Useful when the operator wants a discovery pass without the cost of sink-trace bookkeeping.- populated array (e.g.
["active"]) — whitelist that subset.
{ "sinks_filter": ["active", "body"] }       // narrow to high-leverage sinks
{ "sinks_filter": null }                     // include blind
{ "sinks_filter": [] }                       // crawl-only, sitemap pass
authorized_by
(string)
E-mail address of the authorising operator. Flows into outbound
HTTP requests’ From header so target-site admins can identify
the scan. Polite on third-party targets.
{ "authorized_by": "[email protected]" }
no_fingerprinting
(boolean, default: false)
Skip server / client tech fingerprinting. The fingerprint feeds
platforms on each entry (tomcat,java, php,mysql, etc.);
turning it off speeds the start-up but loses platform attribution
on entries.
{ "no_fingerprinting": true }
audit
What the engine traces. All keys nest under the top-level
"audit" object:
{ "audit": { "elements": ["links","forms"], "parameter_values": true } }
audit.elements
(string[])
Shortcut for the per-element booleans below. Pick from:
links, forms, cookies, nested_cookies, headers,
ui_inputs, ui_forms, jsons, xmls. Equivalent to setting
each named boolean to true.
The presets ship the standard 8-element list (links, forms,
cookies, headers, ui_inputs, ui_forms, jsons, xmls).
nested_cookies is opt-in; link_templates is not an
element — see below.
{ "audit": { "elements": ["links","forms","cookies","headers","ui_inputs","ui_forms","jsons","xmls"] } }
Per-element toggles
audit.links / audit.forms / audit.cookies /
audit.headers / audit.jsons / audit.xmls /
audit.ui_inputs / audit.ui_forms / audit.nested_cookies
(boolean)
Equivalent to listing the element name in audit.elements.
Default on each is unset (nil), which the engine treats as
off; bin/apex_scan flips them on for the default 8.
{ "audit": { "links": true, "forms": true, "cookies": false } }
audit.link_templates
(regex[], default: [])
Regex patterns with named captures for extracting input info
from REST-style paths. Example: (?<id>\d+) against
/users/42 lets the engine treat 42 as the value of an
id input. Not a boolean toggle — putting link_templates
in audit.elements is an error.
{ "audit": { "link_templates": ["users/(?<id>\\d+)", "posts/(?<post_id>\\d+)"] } }
audit.parameter_values
(boolean, default: true)
Inject payloads into parameter values. Turning this off limits
auditing to parameter names (with parameter_names: true) or
extra-parameter injection — rarely what you want.
audit.parameter_names
(boolean, default: false)
Inject payloads into parameter names themselves. Catches mass-assignment / unintended-parameter classes of bug. Adds one extra mutation per known input.
audit.with_raw_payloads
(boolean, default: false)
Send payloads in raw form (no HTTP encoding). Useful when you suspect the target has a decoder that mangles encoded bytes.
audit.with_extra_parameter
(boolean, default: false)
Inject an additional, unexpected parameter into each element. Catches code paths that read undeclared parameters.
audit.with_both_http_methods
(boolean, default: false)
Audit each link / form with both GET and POST. Doubles
audit time — only enable when the target’s behaviour is
known to vary by method.
audit.cookies_extensively
(boolean, default: false)
Submit every link and form along with each cookie permutation. Severely increases scan time — useful when cookie state gates application behaviour.
audit.mode
(string, default: "moderate")
Audit aggressiveness. Values: light, moderate, aggressive.
Higher modes try more payload variants per input.
audit.exclude_vector_patterns
(regex[], default: [])
Skip input vectors whose name matches any pattern. Example:
["^csrf$", "^_token$"] to leave anti-CSRF tokens alone.
audit.include_vector_patterns
(regex[], default: [])
Inverse of exclude_vector_patterns — only audit vectors whose
name matches. Empty means “no whitelist.”
scope
Crawl bounds. All keys nest under "scope":
{ "scope": { "page_limit": 50, "include_subdomains": false } }
scope.page_limit
(int, default: nil — infinite)
Hard cap on crawled pages. The quick-scan preset sets this to
50; the full-scan preset omits it.
scope.depth_limit
(int, default: 10)
How deep to follow links from the seed. Counts every hop regardless of directory layout.
scope.directory_depth_limit
(int, default: 10)
How deep to descend into the URL path tree.
scope.dom_depth_limit
(int, default: 4)
How deep into the DOM tree of each JavaScript-rendered page.
0 disables browser analysis entirely.
scope.dom_event_limit
(int, default: 500)
Max DOM events triggered per DOM depth. Caps crawl time on event-heavy SPAs.
scope.dom_event_inheritance_limit
(int, default: 500)
How many descendant elements inherit a parent’s bound events.
scope.include_subdomains
(boolean, default: false)
Follow links to subdomains of the seed host.
scope.https_only
(boolean, default: false)
Refuse plaintext HTTP follow-throughs.
scope.include_path_patterns
(regex[], default: [])
Whitelist patterns for path segments. Empty = include all.
scope.exclude_path_patterns
(regex[], default: [])
Blacklist patterns. Pages whose paths match are skipped.
{ "scope": { "exclude_path_patterns": ["/logout", "/admin/.*"] } }
scope.exclude_content_patterns
(regex[], default: [])
Blacklist patterns for response body content. A page whose body matches gets dropped from the audit pool — useful for “don’t audit /logout” via response-side pattern.
scope.exclude_file_extensions
(string[])
Skip URLs ending in these extensions. Defaults to a long list
of media / archive / executable / asset / document extensions
(gif, mp4, pdf, js, css, …). Override if you need to
audit something the default skips (e.g. force-include js for
DOM analysis).
scope.exclude_binaries
(boolean, default: false)
Skip non-text-typed responses. Cheaper than maintaining a content-type allowlist; can confuse passive checks that pattern-match on bodies.
scope.restrict_paths
(string[], default: [])
Use these paths INSTEAD of crawling. Pre-seeded path discovery — the engine audits exactly what’s listed.
scope.extend_paths
(string[], default: [])
Add to whatever the crawler discovers. Useful for hidden URLs that aren’t linked from anywhere.
scope.redundant_path_patterns
(object: {regex: int}, default: {})
Pages matching the regex are crawled at most N times. Stops
infinite-calendar / infinite-page traps.
{ "scope": { "redundant_path_patterns": { "calendar/\\d+": 1, "events/\\d+": 5 } } }
scope.auto_redundant_paths
(int, default: 15)
Follow URLs with the same query-parameter-name combination at
most auto_redundant_paths times. Catches the
?page=1&offset=10, ?page=2&offset=20, … pattern without
needing explicit redundant_path_patterns.
scope.url_rewrites
(object: {regex: string}, default: {})
Rewrite seed-discovered URLs before audit:
{ "scope": { "url_rewrites": { "articles/(\\d+)": "articles.php?id=\\1" } } }
http
HTTP client tuning. All keys nest under "http":
{ "http": { "request_concurrency": 5, "request_timeout": 30000 } }
Concurrency / queue / timeouts
http.request_concurrency(int, default: 10) — parallel requests in flight. The engine throttles down automatically if the target’s response time degrades.http.request_queue_size(int, default: 50) — max requests queued client-side. Larger queue = better network utilisation, more RAM.http.request_timeout(int, ms, default: 20000) — per-request timeout.http.request_redirect_limit(int, default: 5) — max redirects to follow on each request.http.response_max_size(int, bytes, default: 500000) — don’t download response bodies larger than this. Prevents runaway RAM on a target that streams large payloads.
Headers / cookies
-
http.request_headers(object, default:{}) — extra headers on every request:{ "http": { "request_headers": { "X-API-Key": "abc123", "X-Debug": "1" } } } -
http.cookies(object, default:{}) — preset cookies:{ "http": { "cookies": { "session_id": "abc", "auth": "xyz" } } } -
http.cookie_jar_filepath(string) — path to a Netscape-format cookie jar file. -
http.cookie_string(string) — raw cookie string,Set-Cookie-style:{ "http": { "cookie_string": "my_cookie=my_value; Path=/, other=other; Path=/test" } }
HTTP authentication
{ "http": {
    "authentication_username": "user",
    "authentication_password": "pass",
    "authentication_type":     "basic"
} }
http.authentication_username/http.authentication_password(string)http.authentication_type(string, default:"auto") — explicit values:basic,digest,ntlm,negotiate,any,anysafe.
Proxy
{ "http": {
    "proxy":          "proxy.example.com:8080",
    "proxy_type":     "http",
    "proxy_username": "user",
    "proxy_password": "pass"
} }
http.proxy(string,"host:port"shortcut)http.proxy_host/http.proxy_port— split form, overridesproxyif set.http.proxy_username/http.proxy_password(string)http.proxy_type(string, default:"auto") —http,https,socks4,socks4a,socks5,socks5_hostname.
TLS / SSL
http.ssl_verify_peer/http.ssl_verify_host(boolean, default: false) — TLS peer / hostname verification. Off by default; bothtruefor full chain validation.http.ssl_certificate_filepath/http.ssl_certificate_type/http.ssl_key_filepath/http.ssl_key_type/http.ssl_key_password— client-cert auth.*_typevalues:pem,der,eng.http.ssl_ca_filepath/http.ssl_ca_directory— custom CA bundle / directory for peer verification.http.ssl_version(string) — pin a TLS version:tlsv1,tlsv1_0,tlsv1_1,tlsv1_2,tlsv1_3,sslv2,sslv3.
{ "http": {
    "ssl_verify_peer":          true,
    "ssl_verify_host":          true,
    "ssl_ca_filepath":          "/etc/ssl/cert.pem",
    "ssl_certificate_filepath": "/path/to/client.pem",
    "ssl_key_filepath":         "/path/to/client.key",
    "ssl_version":              "tlsv1_3"
} }
dom
Browser cluster + DOM crawl. All keys nest under "dom":
{ "dom": { "pool_size": 4, "job_timeout": 120, "wait_for_timers": true } }
-
dom.engine(string, default:"chrome") — browser engine. Chrome is the only supported value. -
dom.pool_size(int, default:min(cpu_count/2, 10) || 1) — number of browser workers in the pool. More workers = faster DOM crawl on JS-heavy targets, more RAM. -
dom.job_timeout(int, sec, default: 120) — per-page browser job ceiling. Pages that don’t settle are dropped from DOM-side analysis. -
dom.worker_time_to_live(int, default: 1000) — re-spawn each browser after this many jobs. Caps memory leaks in long-lived headless instances. -
dom.wait_for_timers(boolean, default: false) — wait for the longestsetTimeout()on each page before considering DOM analysis “done”. Catches lazy-mounted UI. -
dom.local_storage/dom.session_storage(object, default:{}) — pre-seed key/value maps:{ "dom": { "local_storage": { "user": "abc", "preferred_lang": "en" }, "session_storage": { "csrf_token": "xyz" } } } -
dom.wait_for_elements(object:{regex: css}, default:{}) — when navigating to a URL matching the key, wait for the CSS selector value to match before continuing:{ "dom": { "wait_for_elements": { "/dashboard": "#main-app .ready", "/settings/.*": "#settings-form" } } }
device
Browser viewport / identity. All keys nest under "device":
{ "device": { "width": 375, "height": 812, "touch": true, "pixel_ratio": 3.0 } }
device.visible(boolean, default: false) — show the browser window (head-ful mode). Massively slower; primarily for debugging login flows / interactive traps.device.width/device.height(int) — viewport dimensions in CSS pixels.device.user_agent(string) — override the User-Agent header / JS API.device.pixel_ratio(float, default: 1.0) — device pixel ratio. Bump for high-DPI sniffing (some sites serve different markup at2.0).device.touch(boolean, default: false) — advertise as a touch device.
input
How inputs are auto-filled by the engine before mutation. All
keys nest under "input":
{ "input": { "values": { "email": "[email protected]" }, "force": true } }
-
input.values(object:{regex: string}, default:{}) — match an input’s name against the regex key; use the value:{ "input": { "values": { "email": "[email protected]", "first_name": "Scan", "creditcard|cc": "4111111111111111" } } } -
input.default_values(object) — layered undervalues— patterns the engine ships out of the box (first_name→ “John”, etc.). -
input.without_defaults(boolean, default: false) — skip the shippeddefault_valuestable; only yourvaluesget used. -
input.force(boolean, default: false) — fill even non-empty inputs (overwrites pre-populated form fields).
session
Login-session monitoring. The engine periodically checks the
target is still logged in. All keys nest under "session":
{ "session": {
    "check_url":     "https://example.com/account",
    "check_pattern": "Logout"
} }
session.check_url(string) — URL whose response body should matchcheck_patternwhile the session is valid.session.check_pattern(regex) — matched againstcheck_url’s body. Mismatch = session expired; the scan halts pending re-login.
Both fields are required to enable session monitoring; setting only one is rejected at validation time.
timeout
Wall-clock cap on the run. All keys nest under "timeout":
{ "timeout": { "duration": 3600, "suspend": true } }
timeout.duration(int, sec) — stop the scan after this many seconds.timeout.suspend(boolean, default: false) — when the timeout fires, suspend to a snapshot file. Without this the run is aborted.
Auth
Authentication is opt-in. When an embedder registers a bearer-
token validator at boot, the server requires
Authorization: Bearer <token> on every request and returns 401
otherwise (RFC 6750 — WWW-Authenticate: Bearer realm="MCP", error=…).
Without a validator the server accepts unauthenticated traffic — fine
for a loopback bind, dangerous on a public interface.
The resolved principal is stashed at env['cuboid.mcp.auth'] for any
downstream middleware that wants to look it up.
Self-discovery flow
If you’re an AI seeing this server for the first time, do this once:
initialize→ checkserverInfo.name(apex) andversion.resources/list→ you’ll see four URIs. Read all four — they are tiny and answer most of the questions you’d otherwise have to ask. The glossary in particular grounds the field names you’ll see inscan_progress/scan_entriesresults (sink, mutation, action, platforms).prompts/list→ you’ll seequick_scan(capped 50-page smoke test) andfull_scan(uncapped). If the user’s intent matches one (“recon this URL for active inputs”), use it:prompts/getwith their URL gives you a full operator script.tools/list→ discover the 11 tools.outputSchemaon each tells you exactly whatstructuredContentto expect.
After that, drive the scan with no further out-of-band knowledge.
Status semantics
scan_progress.status advances roughly:
ready ──► preparing ──► scanning ──► auditing ──► cleanup ──► done
                              │           │
                              └─► paused ─┘
                              │
                              └─► aborted (terminal)
ready— the Instance has been spawned butstart: truehasn’t yet flipped it pastinstance.run(...).scan_progresscalled on a:readyinstance returns a minimal payload (status + running + seed only — no statistics yet, no entries hash). Don’t trust delta arithmetic until status has advanced.preparing— engine is loading the sink-trace checks, opening the seed URL, and warming the browser cluster. No entries yet, but the sitemap may start populating.scanning— crawl is in flight; new sitemap entries appear, no audits running yet.auditing— the crawl is winding down and sink-tracing is firing against discovered inputs. Most entries land here.paused/aborted—running: false, but onlyabortedis terminal. A paused scan can be resumed withscan_resume.cleanup— engine is finalising state; close todone.done— terminal.scan_reportis now safe to call;running: false.
Treat anything other than done / aborted as still in flight.
Polling cadence
5 seconds is the default cadence the quick_scan prompt suggests, and
it’s a sensible floor:
- Faster than ~2 s burns context tokens for almost no new state.
scan_progresswithwithout_statistics: trueis cheap; thestatisticsblock dwarfs the rest of the payload.- Pass a stable
sessiontoken (typically a UUID) on every poll after the first — the engine returns only items not previously emitted under that token, keeping each response small. The token lives for the engine instance’s lifetime; pick a fresh one to start fresh. - For very long scans (hours), 30 s is fine.
Instance lifetime
Every spawn_instance forks a daemonised SCNR engine subprocess (Apex
runs on the same engine as Spectre, configured for sink-trace recon).
The instance_id is the engine’s RPC token. Things to know:
- The instance survives a client disconnect. If you forget to call
kill_instance, the process keeps running until something kills it (host shutdown, OOM, manual signal). Always wire akill_instancein your error path. - The instance does not survive an MCP-server restart cleanly. The
daemonised engine keeps running but the MCP server’s in-memory
@@instancesmap is empty after a restart, so you can’tkill_instanceit through MCP any more (you’d need a process-level kill). Don’t restart the MCP server while scans are mid-flight. - Each instance reserves about 2 GB RAM and 4 GB disk by default. On a laptop, parallel scans are bounded by RAM; the host won’t proactively refuse a third spawn if the second one is still warming up.
start: falseis rare in practice. It registers an idle instance that sits there waiting for arun, and MCP’sspawn_instancedoesn’t have a separate “start now” tool — driving the run requires out-of-band RPC. Use it when something else is going to drive the run.
Error idiom
Engine exceptions don’t crash the MCP server — MCPProxy.instrumented_call
wraps every body with rescue => e. The wire response is:
{
  "result": {
    "isError": true,
    "content": [
      { "type": "text", "text": "error: <ErrorClass>: <message>" }
    ]
  }
}
Common shapes:
error: ArgumentError: Invalid options!—instance.run(options)rejected the shape. Readapex://options/referenceand try again.error: Toq::Exceptions::RemoteException: …— the inner RPC client to the engine subprocess raised. Usually means the engine itself is in a bad state. Tryscan_errorsfor clues; if that’s empty,kill_instanceand respawn.error: JSON::GeneratorError: "\xNN" from ASCII-8BIT to UTF-8— the engine produced binary bytes that aren’t valid UTF-8 (a response body, HTTP header, etc.). Affectsscan_reportmore than the streaming tools. Skip the report;scan_progress+scan_entrieswill still work.unknown instance: …— theinstance_idyou passed isn’t in the server’s local map. Either the MCP server was restarted (which clears@@instances), or the id is stale. Re-spawn_instance.
Validation errors (missing required arg, type mismatch) come back through the JSON-RPC error envelope, not as a tool error:
{ "error": { "code": -32602, "message": "Missing required arguments: instance_id" } }
Options trivia
- Apex auto-loads its two sink-tracing checks (
sink_trace_force,sink_trace_force_dom) automatically — you do not passchecks. Don’t try to override; the recon flow depends on these being the active set. audit.elementsdefaults to all kinds when the key is omitted, which is what the CLI does. Pass an explicit list to restrict — e.g.["links", "forms"]skips cookies, headers, JSON/XML bodies, etc.scope.page_limitis baked into the quick-scan preset at 50 — a real-site smoke test that finishes in minutes. Override thepage_limitprompt arg (or the JSON directly) for a smaller / larger cap; switch to thefull-scanpreset (or thefull_scanprompt) for an uncapped recon. Sensible explicit values: 30 (smaller smoke test), 200 (representative).authorized_by— set this to the operator’s email; it shows up in the engine’s outbound HTTPFromheader so target-site admins can identify the scan. Not required, but polite on third-party targets.sinks_filter— record-time whitelist of sink kinds (mirrors the CLI’s--sink-filter). Four states:- omit the key → MCP server applies the default
["active", "body", "header_name", "header_value"](every sink kind exceptblind). Mirrors theapex_scanCLI default. null→ no filter, log every sink kind includingblind.[](empty array) → log NOTHING. The engine still crawls and produces a sitemap; no entries get recorded. Useful for a pure discovery pass.- populated array (e.g.
["active"]) → whitelist that subset. Hits at filtered-out sinks are skipped at trace time and never enterscan_entries/scan_report. Seeapex://options/referencefor the on-the-wire description.
- omit the key → MCP server applies the default
Conventions baked into the descriptions
The tool / prompt / resource descriptions are deliberately self-grounding:
- Per-property descriptions on every tool argument (no buried-in-text args).
- Cross-references use namespaced names (
scan_resume, notresume) so the AI can call them verbatim. - Preconditions are stated where they exist (
scan_pause“the scan must currently be running”,scan_resume“must have been paused viascan_pause”). Calling out of order returns an MCP tool error rather than a routing failure. - Domain terms (sink, mutation, action, platforms, digest) are defined
in
apex://glossaryand cross-referenced from the relevantoutputSchemaproperty descriptions, so a model parsingstructuredContentcan resolve any unknown field name back to the glossary in one hop.
Things the protocol doesn’t expose yet
For honesty — places where you’d still need out-of-band knowledge:
- Live progress streaming. The MCP spec supports
notifications/progressfor long-running operations; this server doesn’t emit them yet. You poll. - Structured error codes. Errors come back as text. If you want to branch on “bad option key” vs “engine crashed” vs “auth failed”, you’re parsing the text.
- Sink catalogue. There’s no
list_sinkstool; if a user asks “which sinks does Apex trace”, you need out-of-band knowledge or to inspect the engine source.
Each of those is on the roadmap. Until they land, the resources + prompt expansion are the supported way to ground a model.
Connecting an MCP client
Most clients accept a Streamable HTTP server entry verbatim:
{
  "mcpServers": {
    "apex": {
      "url": "http://127.0.0.1:7331/mcp"
    }
  }
}
That’s all. After initialize, the client sees:
- 11 tools (3 framework + 8 per-scan), each with input + output schema.
- 2 prompts (
quick_scan,full_scan). - 4 resources.
If your client only speaks stdio (older Claude Desktop builds), use any community stdio↔HTTP MCP bridge in front. Cursor, Claude Code, and Continue speak Streamable HTTP natively.
End-to-end example — curl
Initialize, capture the session id, acknowledge:
curl -i -X POST http://127.0.0.1:7331/mcp \
  -H 'Content-Type: application/json' \
  -H 'Accept: application/json, text/event-stream' \
  --data '{
    "jsonrpc": "2.0", "id": 1, "method": "initialize",
    "params": {
      "protocolVersion": "2025-06-18",
      "capabilities":    {},
      "clientInfo":      { "name": "curl", "version": "0" }
    }
  }'
# → response header: Mcp-Session-Id: <SID>

curl -X POST http://127.0.0.1:7331/mcp \
  -H 'Content-Type: application/json' \
  -H 'Accept: application/json, text/event-stream' \
  -H "Mcp-Session-Id: $SID" \
  --data '{ "jsonrpc": "2.0", "method": "notifications/initialized" }'
Spawn a scan against http://testfire.net/ using the quick-scan
defaults:
curl -X POST http://127.0.0.1:7331/mcp \
  -H 'Content-Type: application/json' \
  -H 'Accept: application/json, text/event-stream' \
  -H "Mcp-Session-Id: $SID" \
  --data '{
    "jsonrpc": "2.0", "id": 2, "method": "tools/call",
    "params": {
      "name": "spawn_instance",
      "arguments": {
        "options": {
          "url": "http://testfire.net/"
        },
        "start": true
      }
    }
  }'
# → result.structuredContent: { instance_id, url }
Poll progress, fetching only items new since the previous call
under the chosen session token (any caller-chosen string):
curl -X POST http://127.0.0.1:7331/mcp \
  -H 'Content-Type: application/json' \
  -H 'Accept: application/json, text/event-stream' \
  -H "Mcp-Session-Id: $SID" \
  --data '{
    "jsonrpc": "2.0", "id": 3, "method": "tools/call",
    "params": {
      "name": "scan_progress",
      "arguments": {
        "instance_id":         "'$IID'",
        "session":             "client-poll-1",
        "without_statistics":  true
      }
    }
  }'
Fetch entries and tear down:
curl -X POST http://127.0.0.1:7331/mcp ... \
  --data '{ "jsonrpc": "2.0", "id": 4, "method": "tools/call",
            "params": { "name": "scan_entries",
                        "arguments": { "instance_id": "'$IID'" } } }'

curl -X POST http://127.0.0.1:7331/mcp ... \
  --data '{ "jsonrpc": "2.0", "id": 5, "method": "tools/call",
            "params": { "name": "kill_instance",
                        "arguments": { "instance_id": "'$IID'" } } }'
The same loop expressed as a quick_scan prompt expansion is one
prompts/get call away.
Web UI
The WebUI allows you to easily run, manage and schedule scans and their results via an intuitive web interface.
Table of contents
Boot-up
To boot the Pro interface please run:
bin/apex_pro
After boot-up, you can visit the interface via your browser of choice.
Features
Scan management
- Quick scan. A one-input form in the navbar will scan any URL with sane defaults — useful for ad-hoc spot checks without leaving the current page.
- Parallel scans. Run multiple scans concurrently against the same site, different sites, or both — bounded only by configured worker capacity.
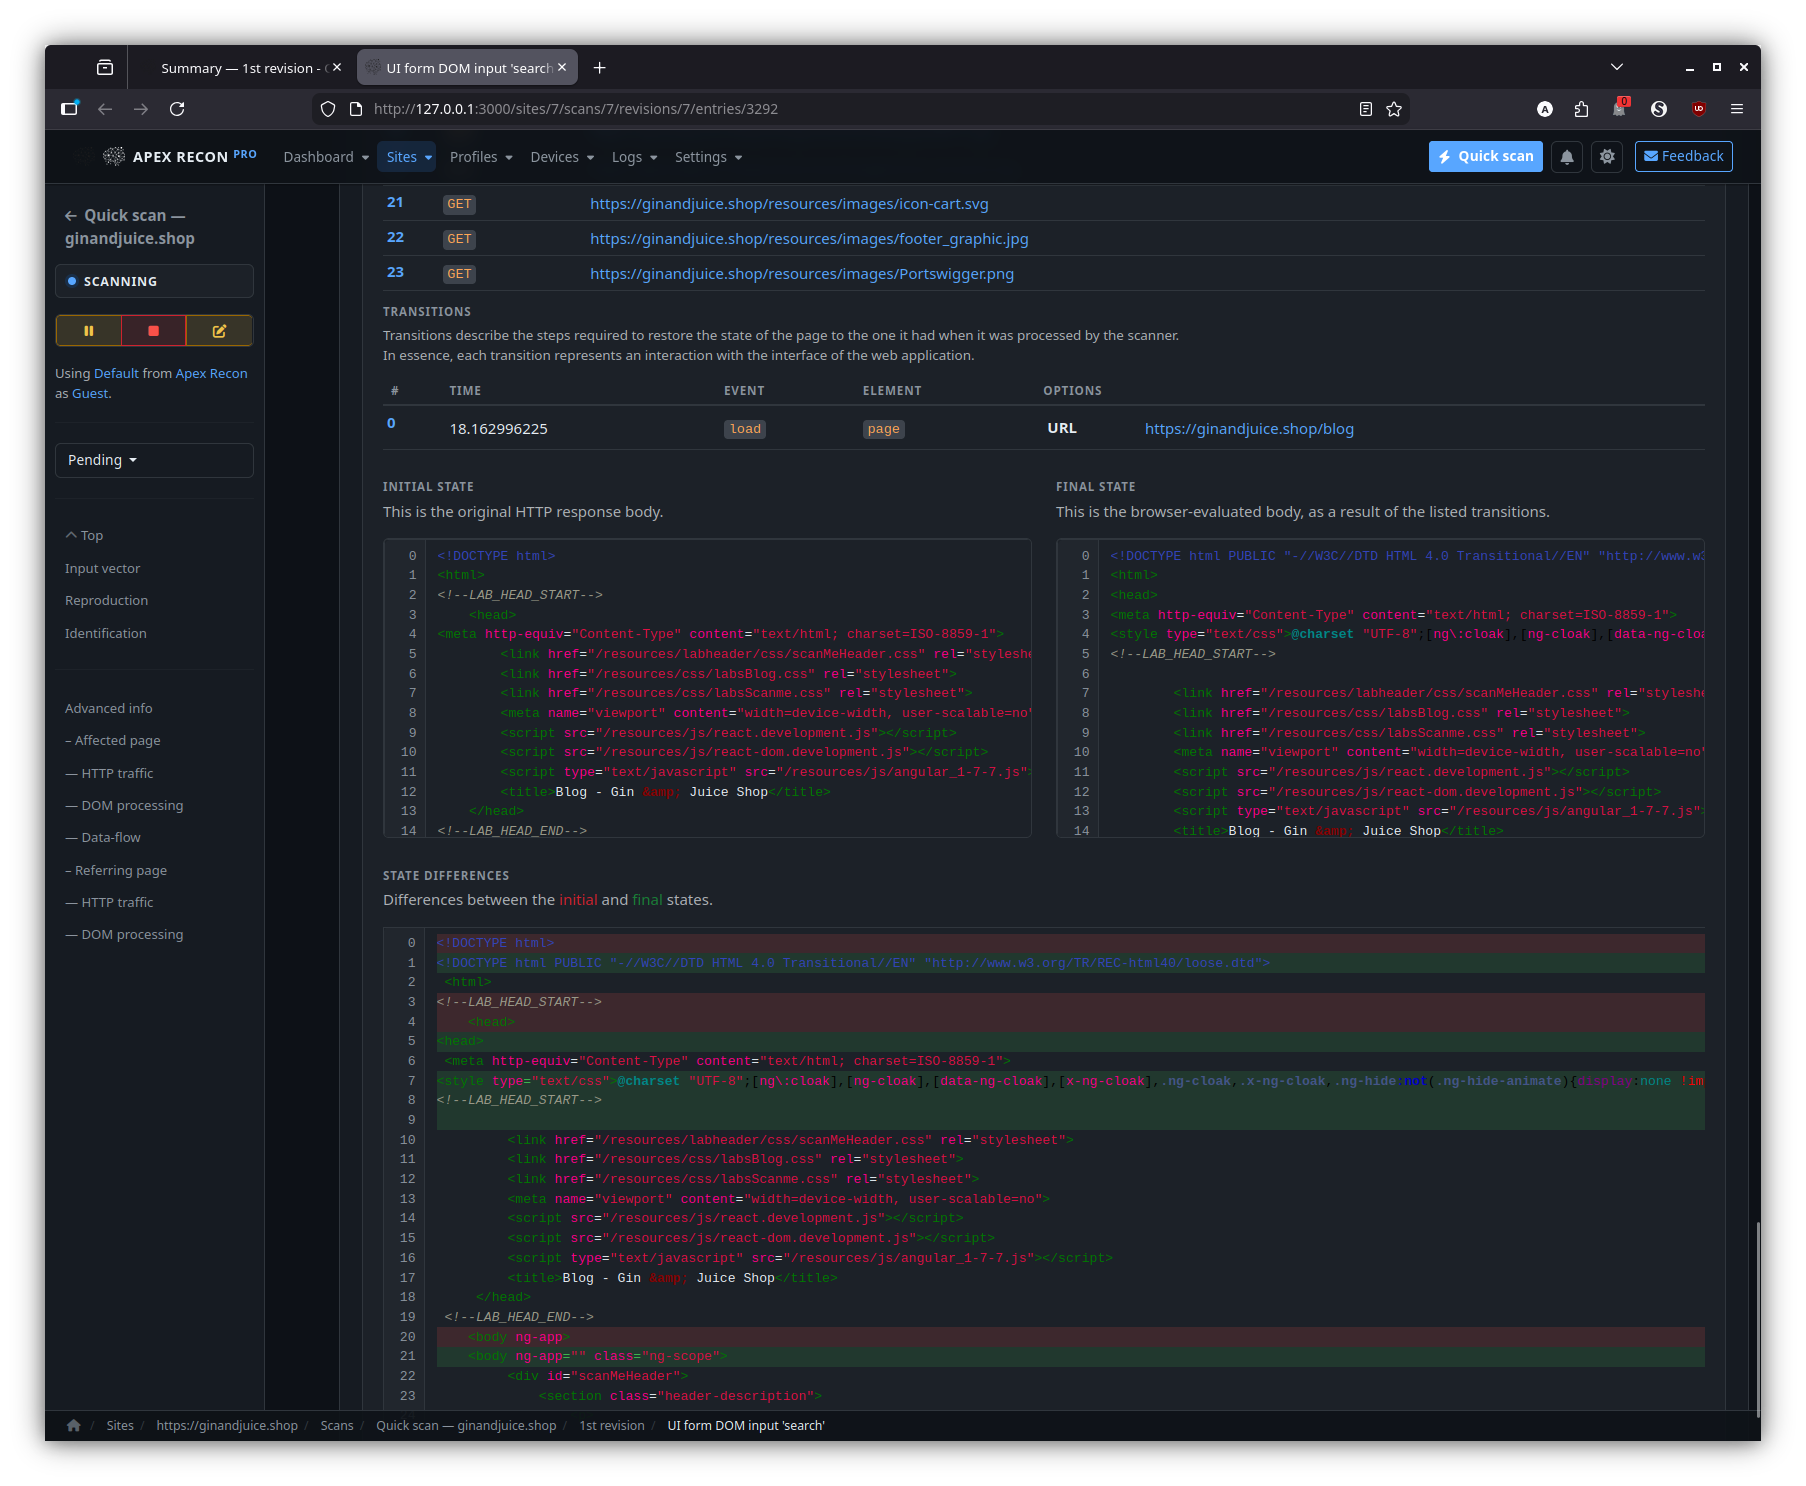
- Recurring scans. Re-scan the same target on a schedule and get an
automatic state diff of every entry compared to the previous revision:
- Fixed — entries that no longer appear.
- Regressions — fixed entries that re-appeared.
- New — first-time findings.
- Trusted / untrusted / reviewed / false-positive — manual triage states that carry forward across revisions.
- Scheduled scans. Either pick from preset frequencies (hourly, daily, weekly…) or paste a cron expression. The scheduler surfaces upcoming occurrences and flags conflicts (overlapping start times, parallelism ceiling) before they fire.
- Suspend / resume / repeat. Pause a long-running scan and resume from the same on-disk session later. One-click repeat re-runs a finished scan with the exact same configuration.
Live monitoring
- Real-time progress. Coverage, request rate, discovered pages and newly-found entries stream into the UI over Action Cable as the scan runs — no manual refresh.
- Live event-driven cache busts. Per-user dashboard / navbar caches invalidate the moment a model commits, so counts and badges stay truthful without polling.
- Scan, revision and site live views. Drill in at the level you need: whole-site activity, a specific scan or a single revision.
Findings & analysis
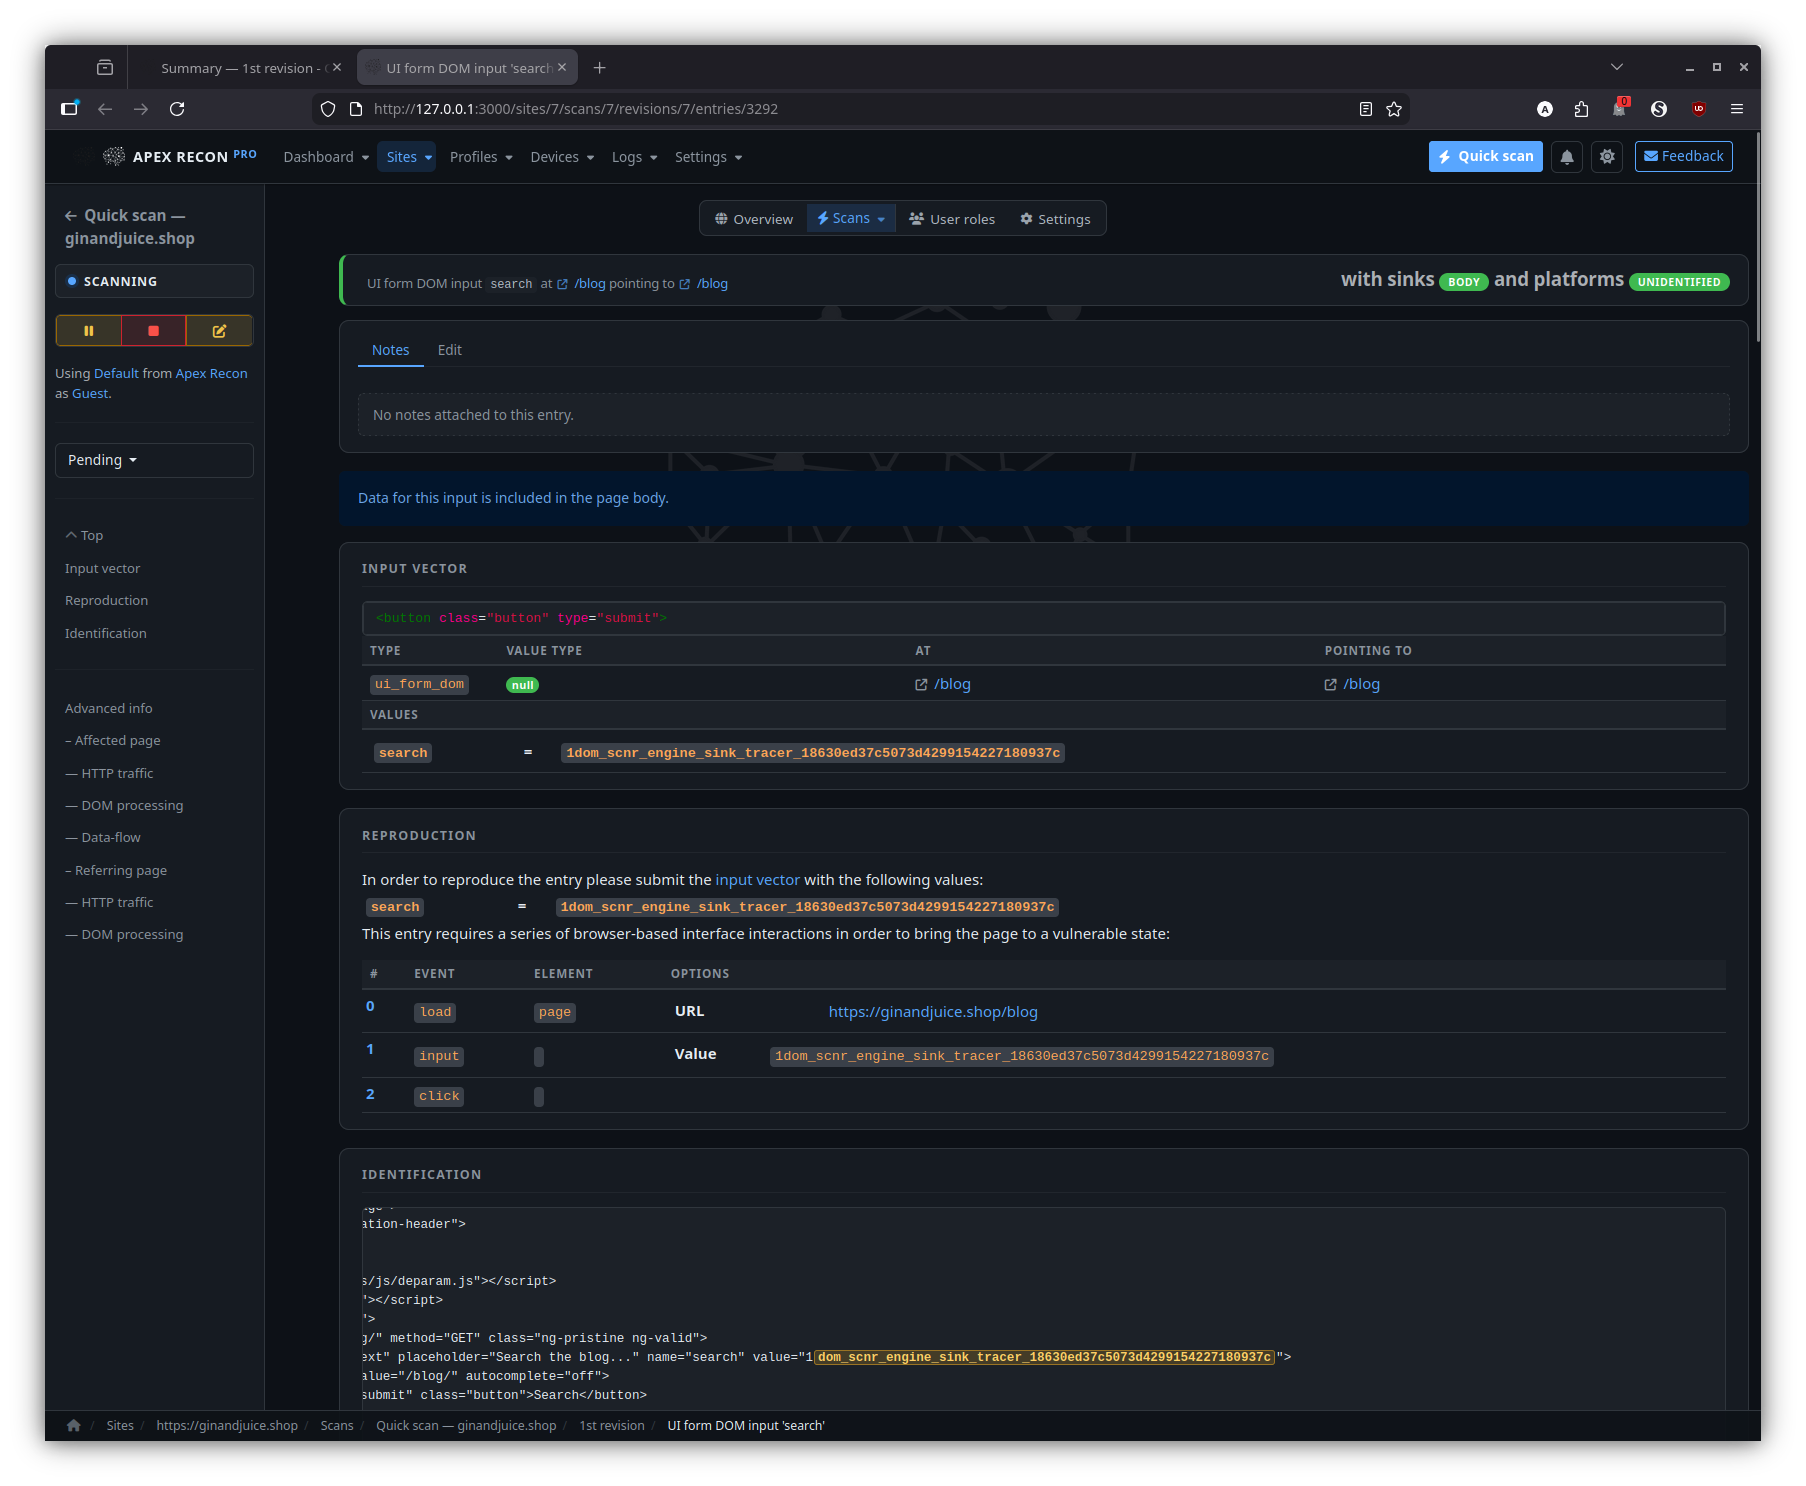
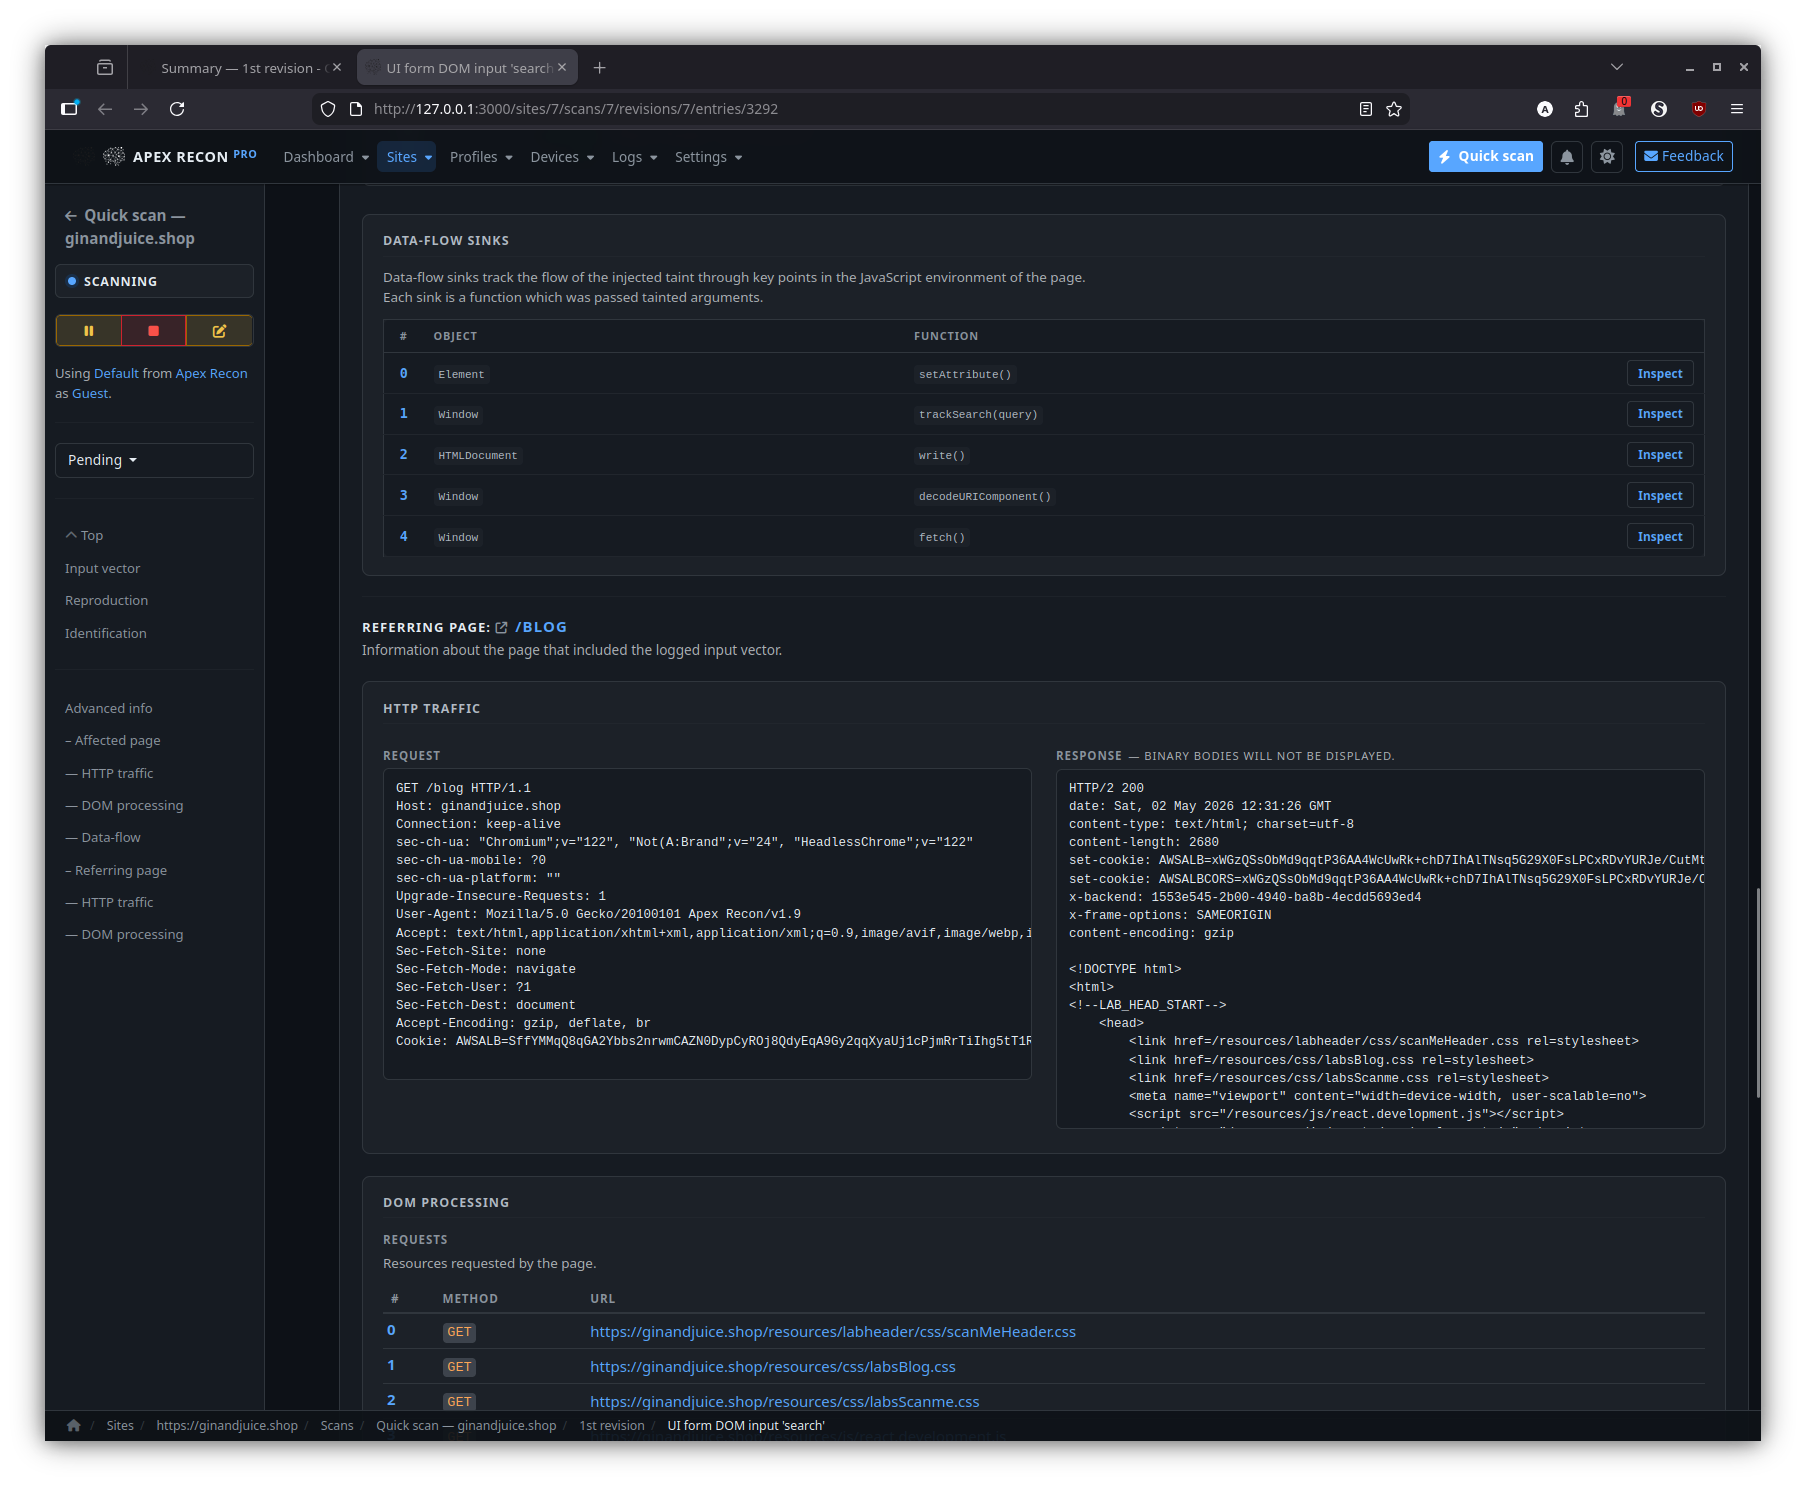
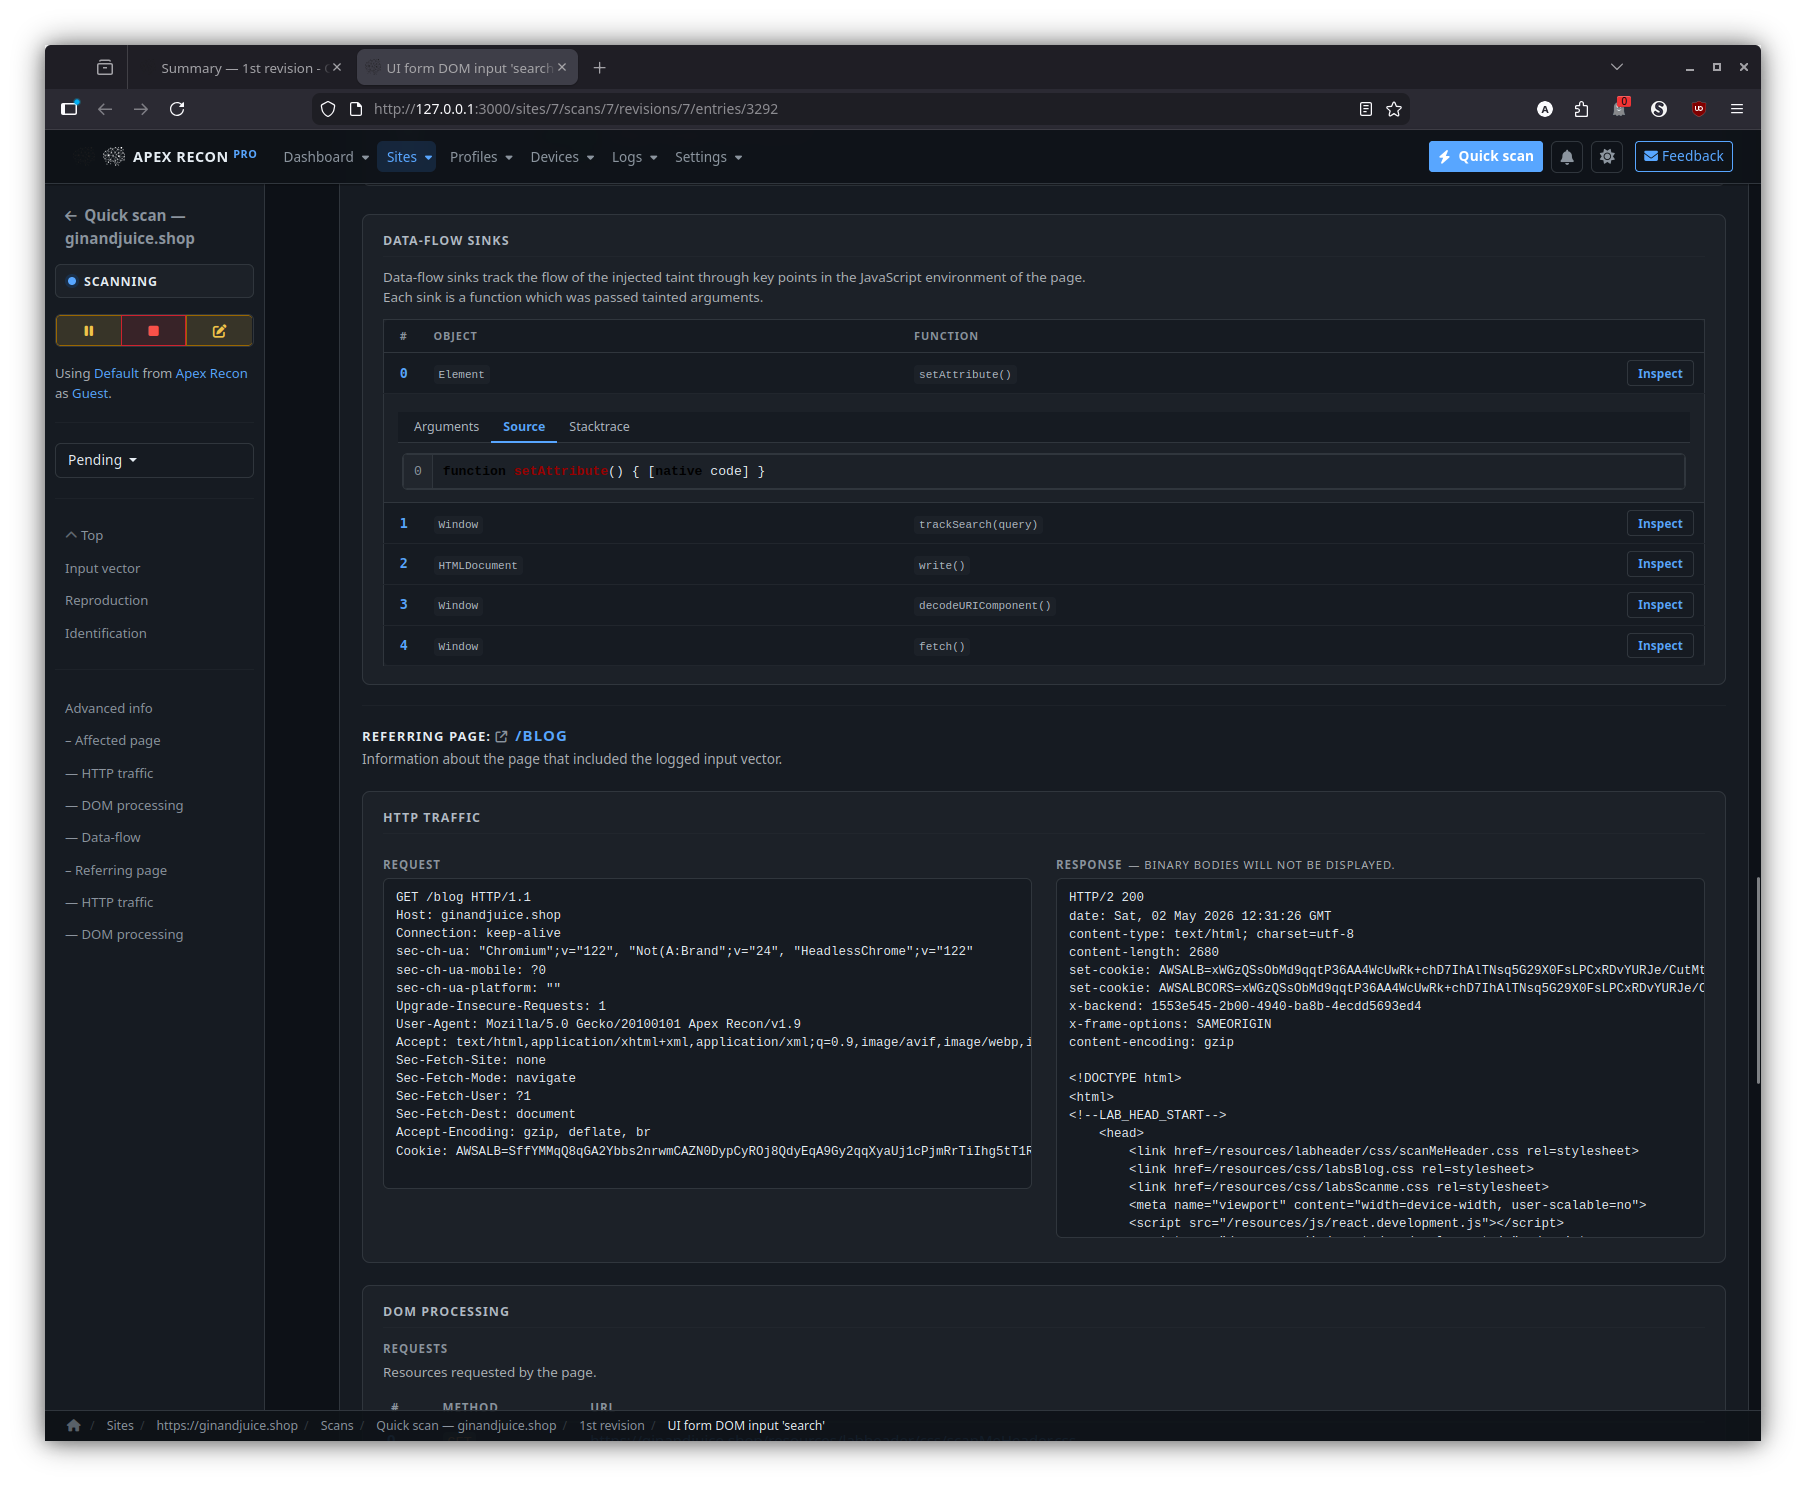
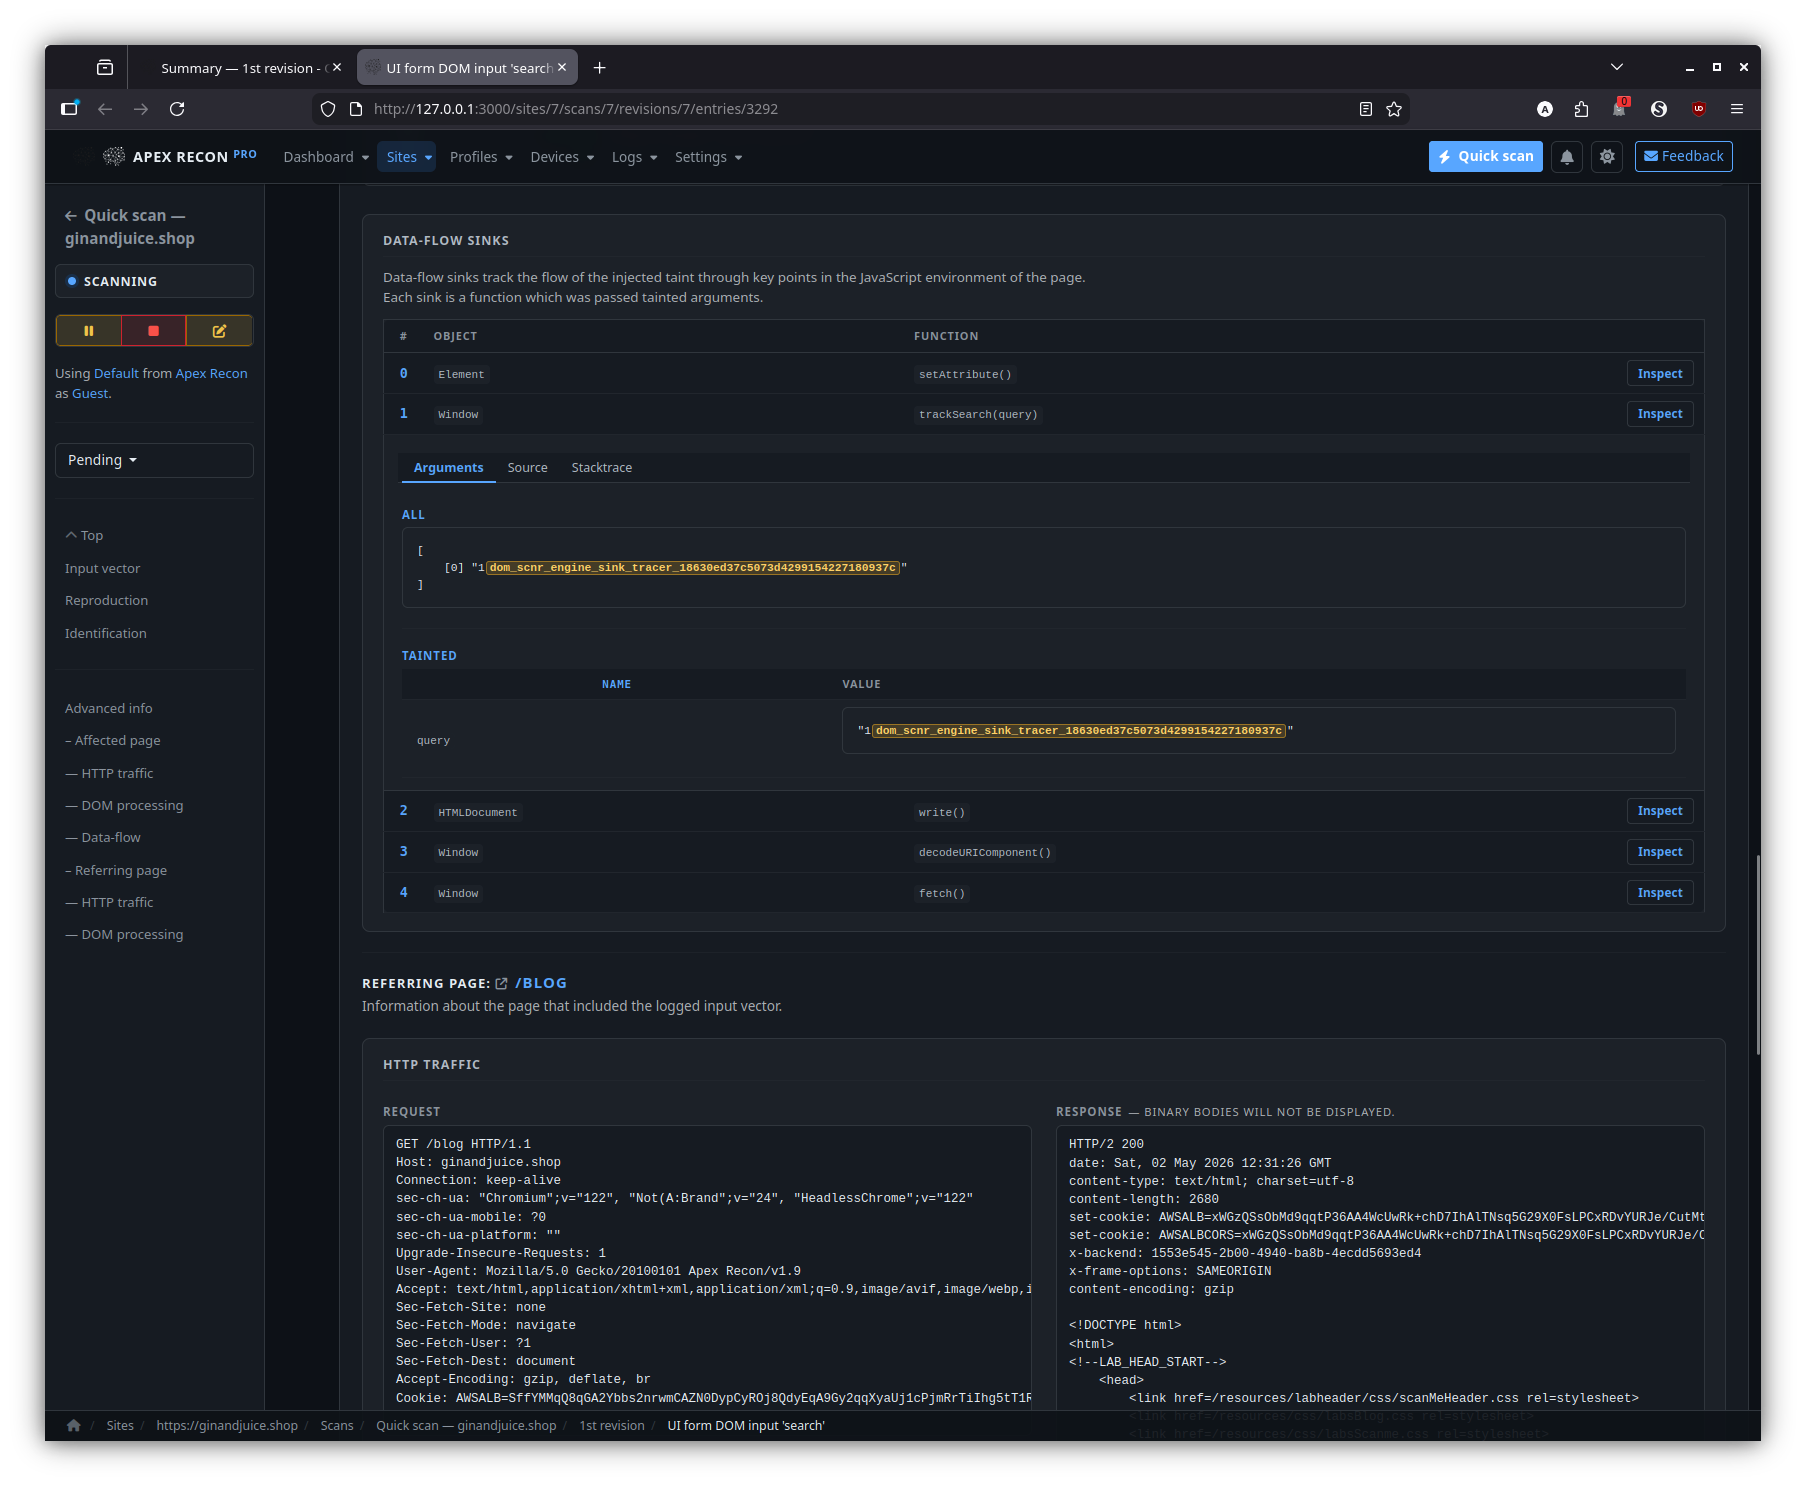
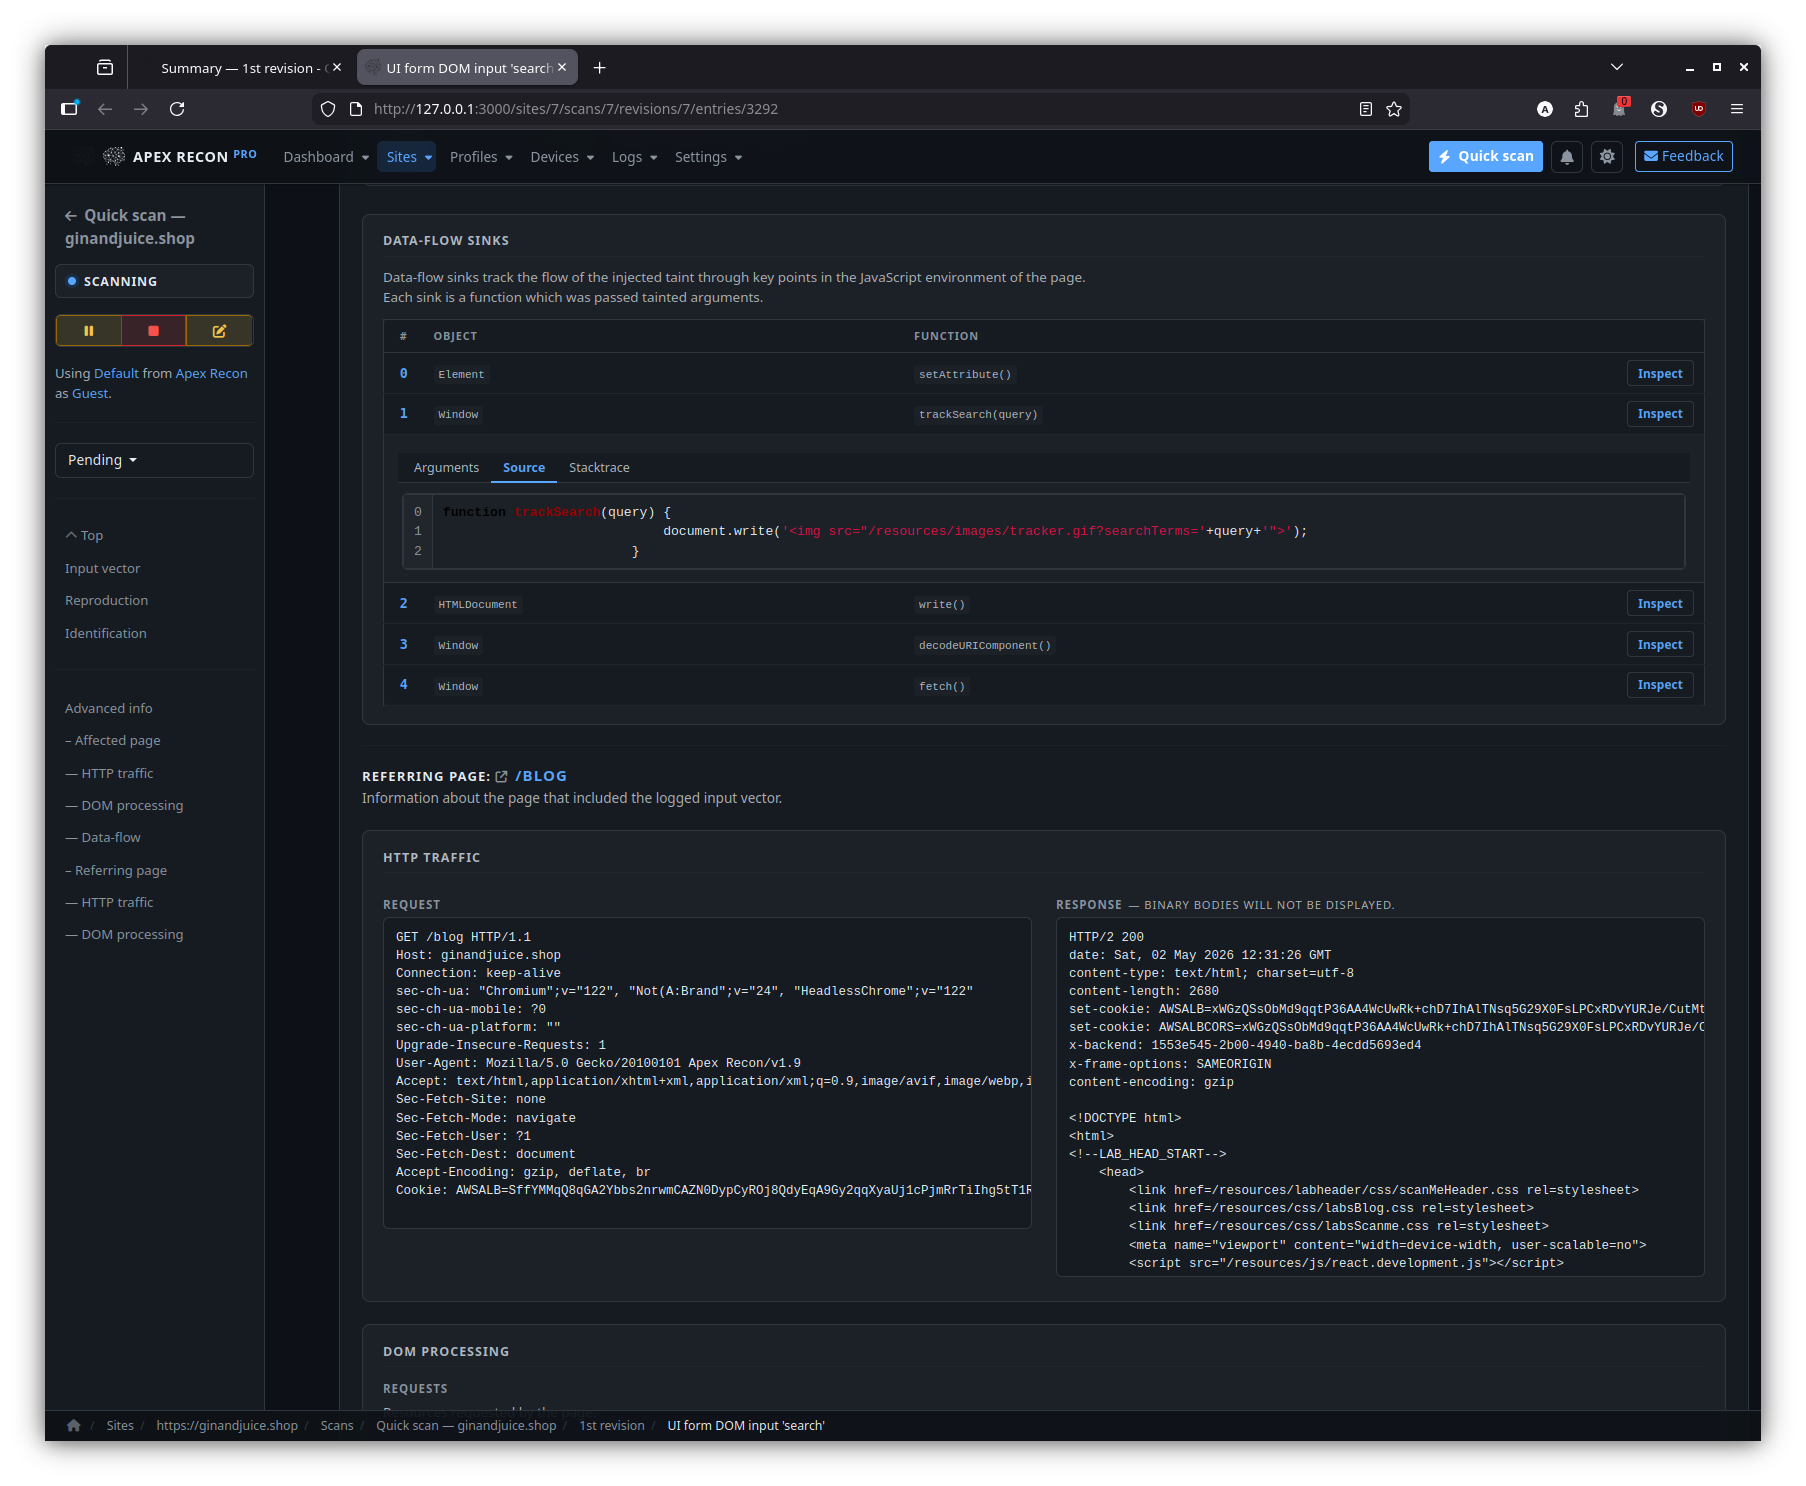
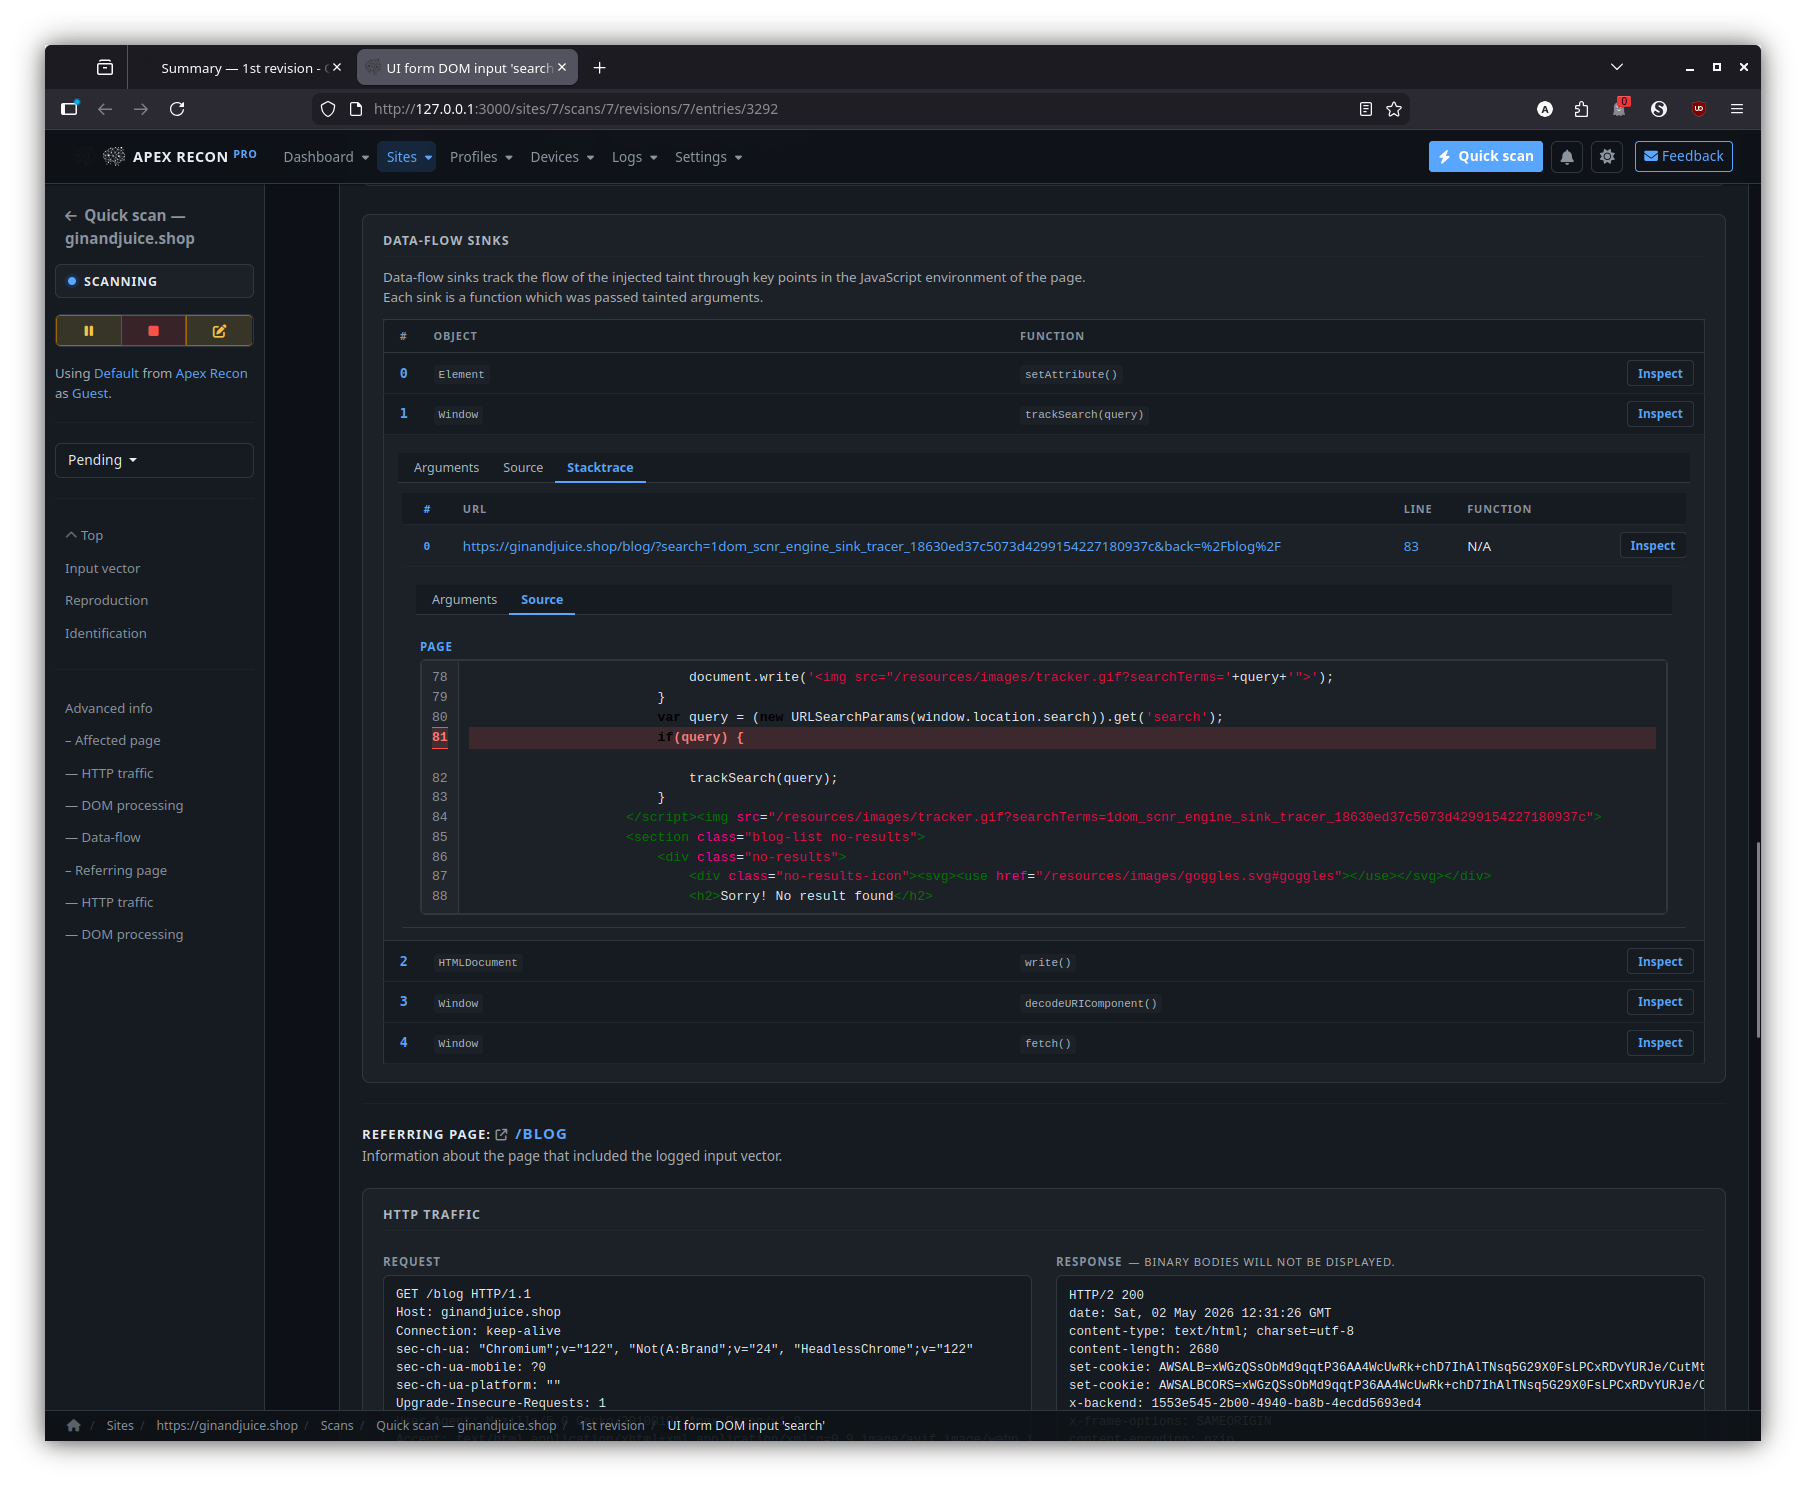
- DOM data-flow sinks. The signature feature: every entry is presented with the full source-to-sink data-flow trace through the rendered page, including the captured stack frames at each hop and the page snapshot inline.
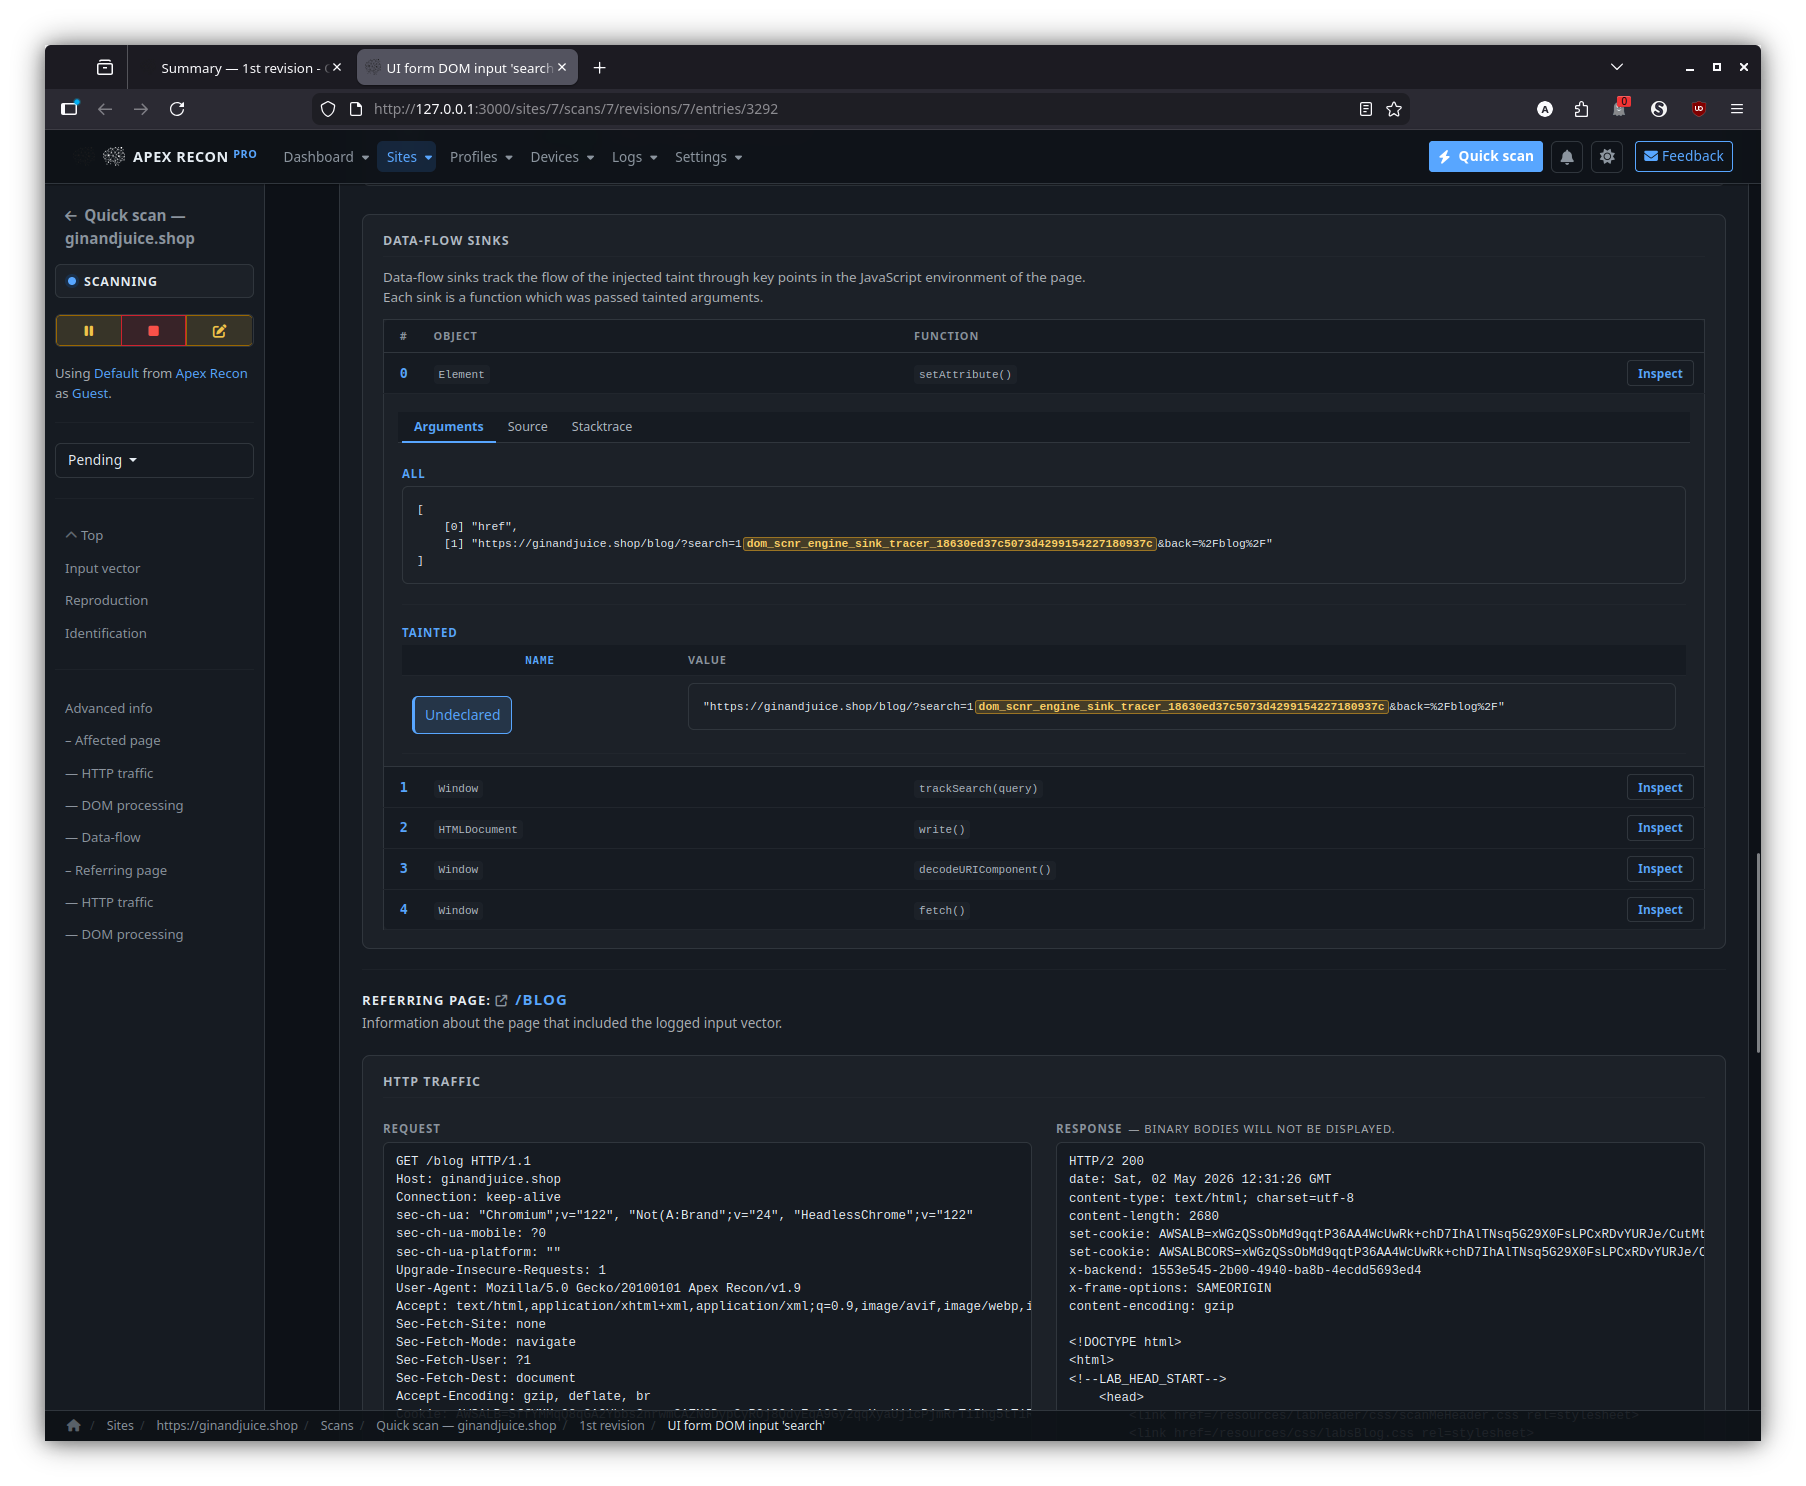
- Sink inspector. Step through the sink chain hop-by-hop, expand any stack frame to its surrounding source, and pivot to the request / response that triggered the flow.
- Entry detail. Each finding shows the captured request / response, affected input vector, normalised proof and the live page state at the moment of capture.
- State diff across revisions. When recurring scans review their results, every entry surfaces its trajectory across revisions — first-seen / last-seen / fixed / regression — at a glance.
- Coverage explorer. Every page the scanner reached, with HTTP status, content-type and a one-click jump to the entries attached to it.
- Powerful filtering. Stack state / type / scan / revision filters; narrow by site, by URL pattern, by sink kind; permalinks survive reload and live-refresh.
Configuration
- Scan profiles. Reusable bundles of checks, scope rules, audit options and plug-ins. Per-user, per-site or shared.
- Per-site overrides. Override profile scope rules at the site level without forking a whole profile.
- Device emulation. Scan as a desktop browser, mobile, tablet, or any custom user-agent / viewport / touch combination.
- Site user roles. Authenticate the scanner as one or more
application personas:
- Form login — declarative URL + form parameters.
- Script login — drop in Ruby with a prepared browser driver (Watir) or HTTP client.
- Each role gets its own captured session that persists across revisions.
Operations & audit
- Server / scanner / network health. Request rate, response times, browser-pool utilisation, error counts, queue depth — surfaced in charts that update live, both globally and per-revision.
- Full audit log. Every change to sites, scans, revisions, entries and user roles is captured (PaperTrail) with the actor, the diff and a click-through to the affected object — even after the object itself has been deleted.
- Resilient scheduler. SQLite writer-lock contention, autoloader races and transient RPC errors are handled internally; the UI stays responsive while two or more scans hammer the database.
Reporting & integrations
- Multi-format export. HTML, JSON, XML, plain-text and the application-native AER archive — at the scan, revision or filtered result-set level.
- Notifications. Per-event email / browser push for scan start / finish / failure / suspension.
Djin! — in-app AI assistant
- Side-dock chat on every page. A right-side panel (with full- page expand and a launcher button bottom-right) that uses your configured AI provider (OpenAI or Claude). Streamed replies via Action Cable; conversation history persists per-user.
- Page-aware grounding. Each turn carries the current
(controller, action, resource ids)so questions like “what’s this entry?” or “what did this revision pick up?” are answered against what you’re looking at, no need to spell it out. - Read tools. Djin! can call
list_sites/list_scans/list_revisions/list_entries, drill into a single record (fetch_entry,fetch_revision), free-textsearchacross sites / scans / entries (including entry type / vector source / page URL / DOM data-flow sink fields / stack-frame URLs / JS function names), pull the audit log (list_events), the crawled URL coverage (list_sitemap), profiles / devices / site-roles / notifications, and an operator-wide rollup (fetch_dashboard). Every query is scoped to the records you own — Djin! cannot see another operator’s data. - Navigation. “Take me there” works — Djin! resolves
navigate_to({ kind: 'entry', id: <digest> })or top-level destinations likedashboard,sites,logs,profiles,devices,settings,notificationsand the browser jumps there. - Approval-gated write actions. Djin! can also propose
mark_reviewed,clear_state,pause_scan/resume_scan/abort_scan/suspend_scan/restore_scan,start_scan,quick_scan,create_site_role, andmark_notifications_read. Every write tool surfaces an inline yellow card in the dock with the proposed args — nothing happens until you click Approve. Deny instead and Djin! sees the rejection reason and adjusts. - Audit trail. Approved Djin!-driven mutations are tagged
with
whodunnit = "djin:<your_id>"in the PaperTrail log, so the per-user activity feed distinguishes AI-driven actions from hand-driven ones. - Cancel & rate-limit. Stop a streaming reply mid-flight; a
configurable per-user daily token budget caps spend across
conversations (
0for unlimited, in Settings). - Privacy & opt-in. Disabled by default; flip on in Settings once your AI provider key is configured. The dock surfaces an empty “configure in Settings” hint instead of failing silently if the key isn’t set.
Quality of life
- Light & dark themes with a one-click toggle that persists across
sessions and respects
prefers-color-schemeon first visit. - Per-page UI state persistence. Section open/closed, collapsed details, table sort and filter selections are remembered per browser without server round-trips.
- Keyboard-friendly forms and focus-aware live-refresh: an open
<select>or focused input is never swapped out from under you. - First-run welcome. A guided empty-state experience walks new installs from “no sites yet” to “scanning” without docs.
Screenshots
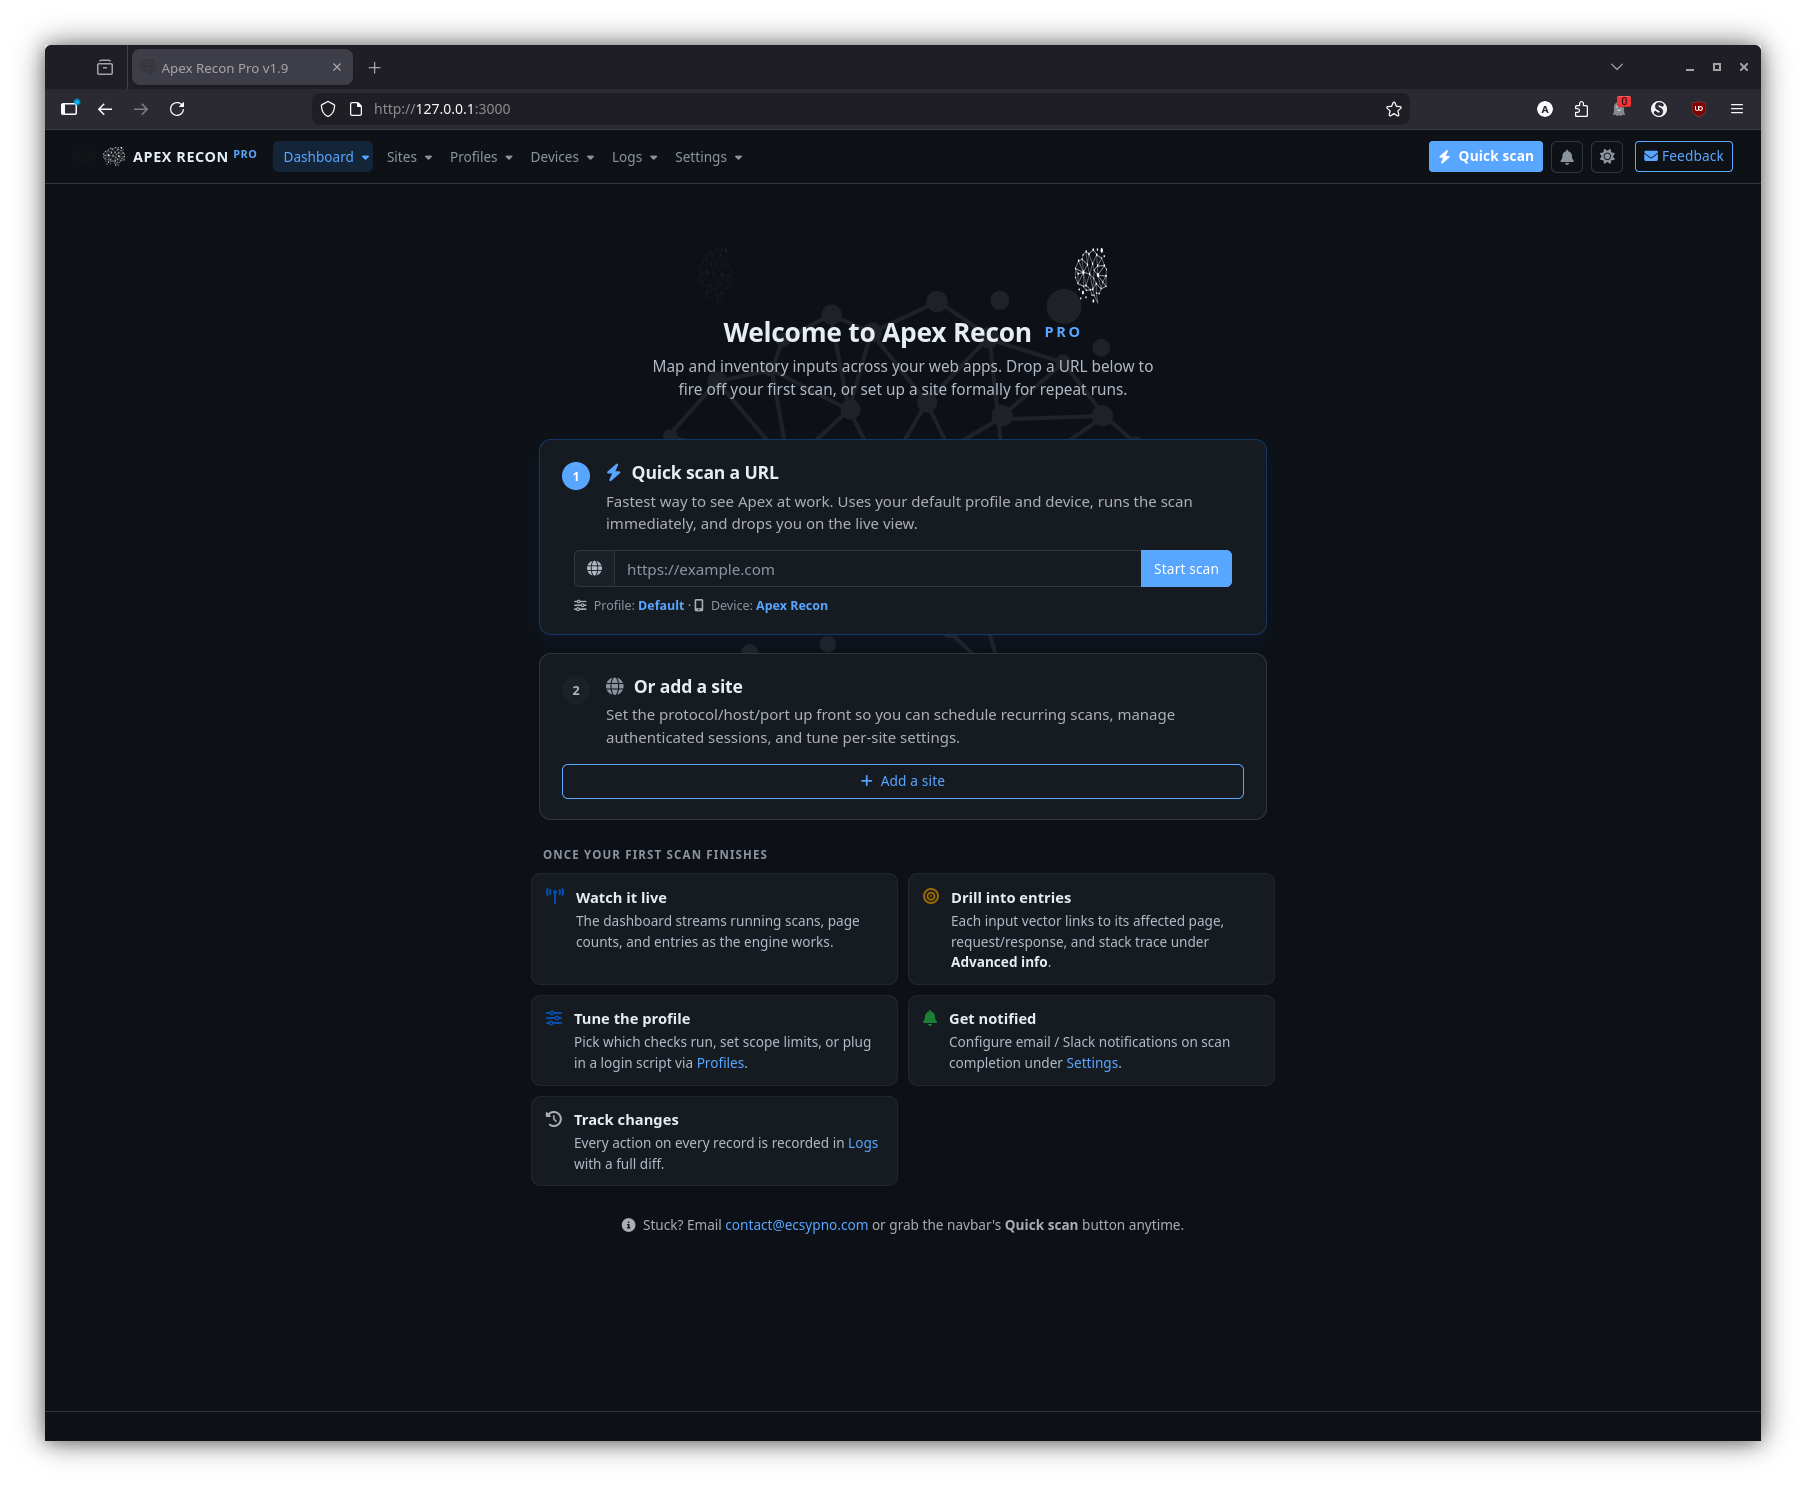
Welcome
The first-run experience: an empty-state landing page with a quick-scan form and a path to add your first site.
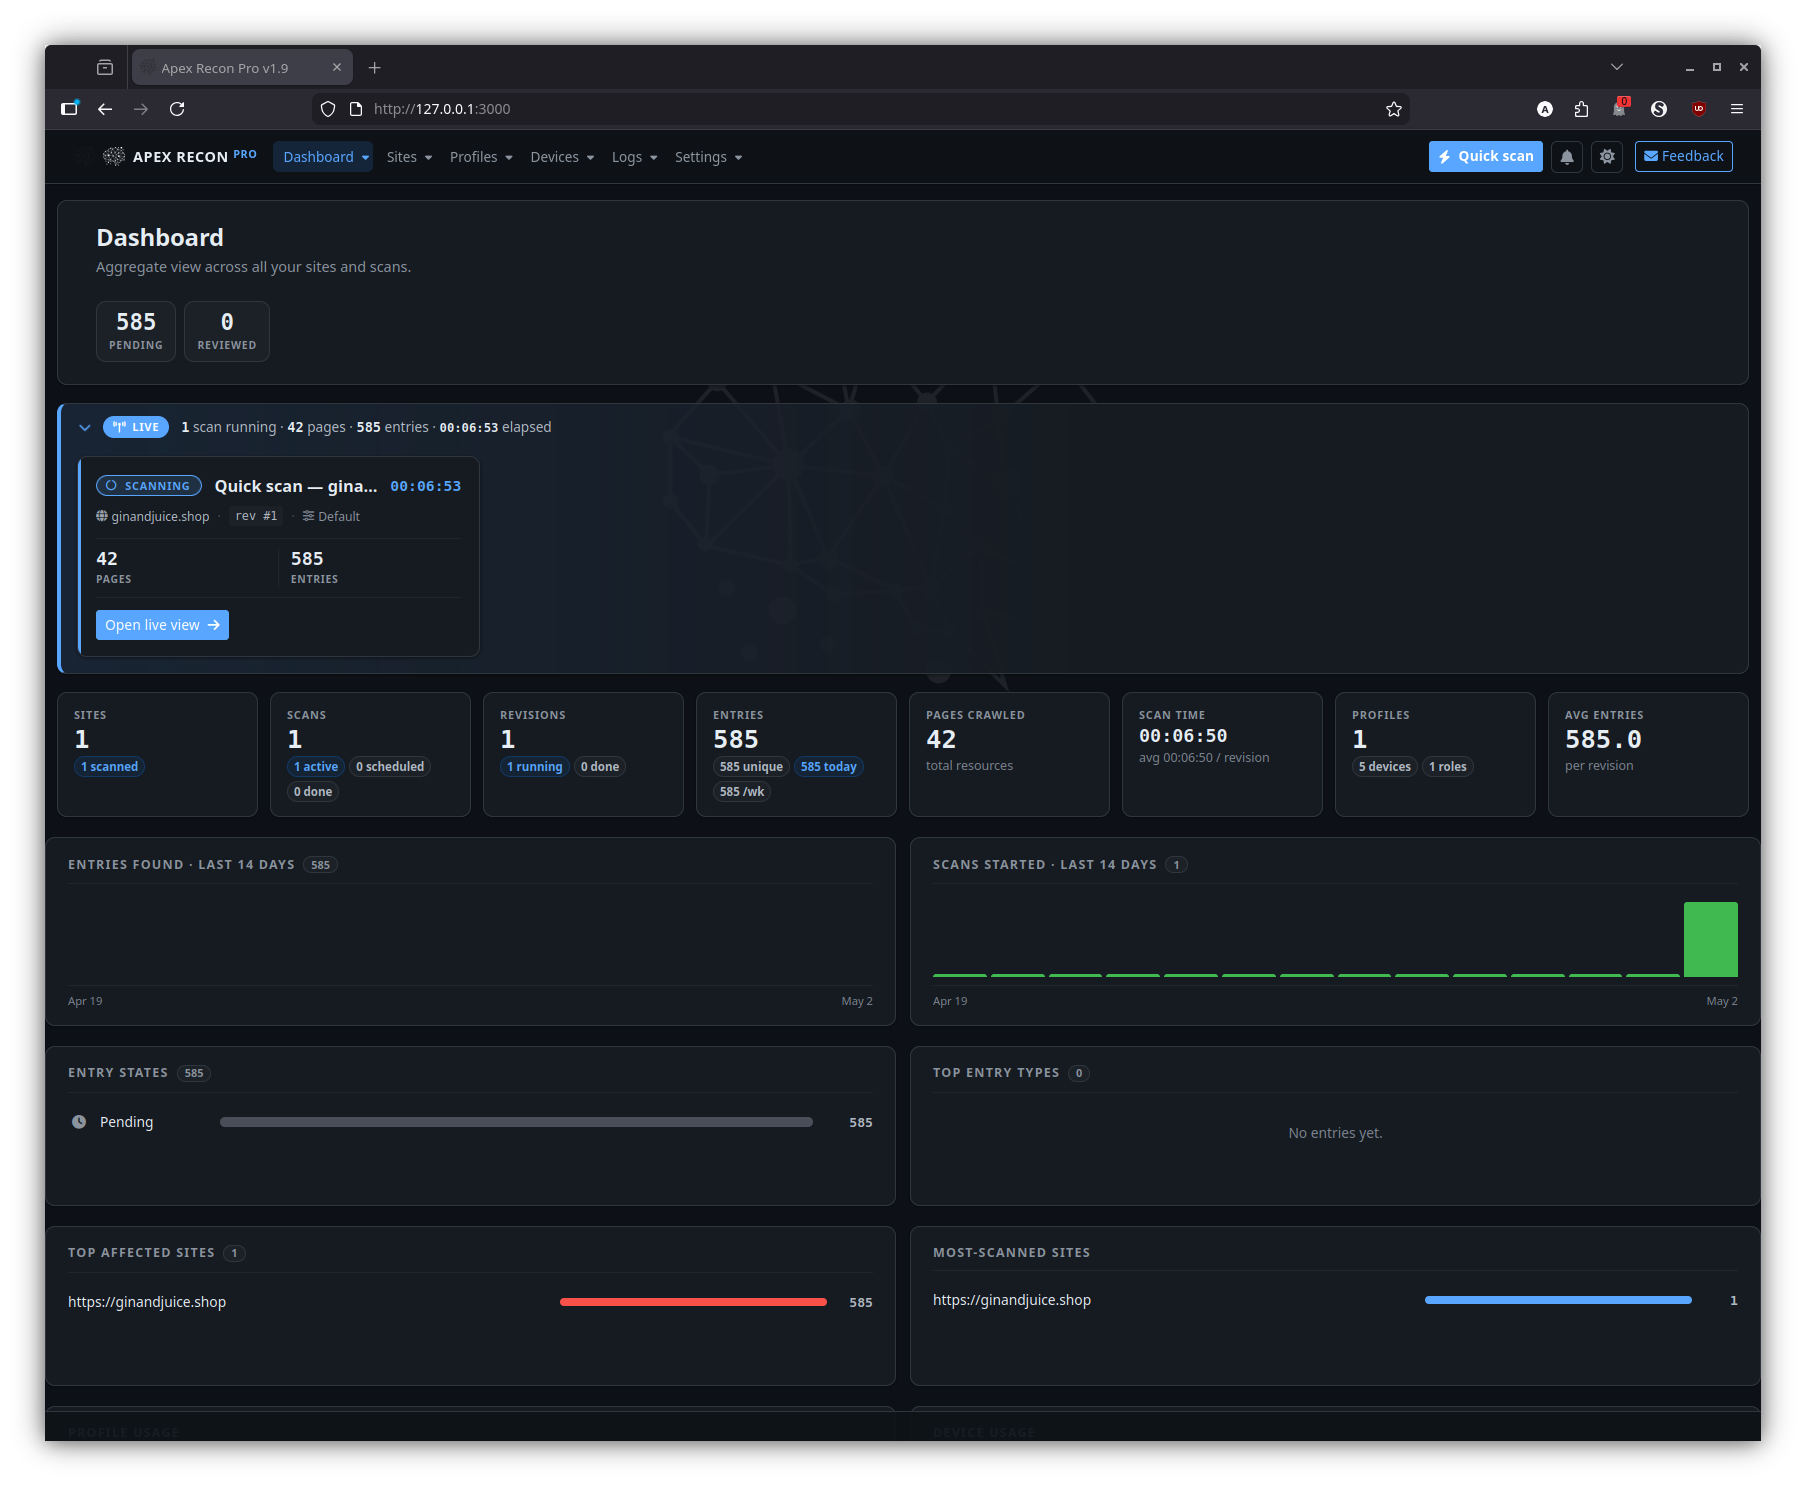
Dashboard
The home page once you have at least one site. It surfaces running scans, recent activity, aggregate counts and per-site health at a glance.
Sites
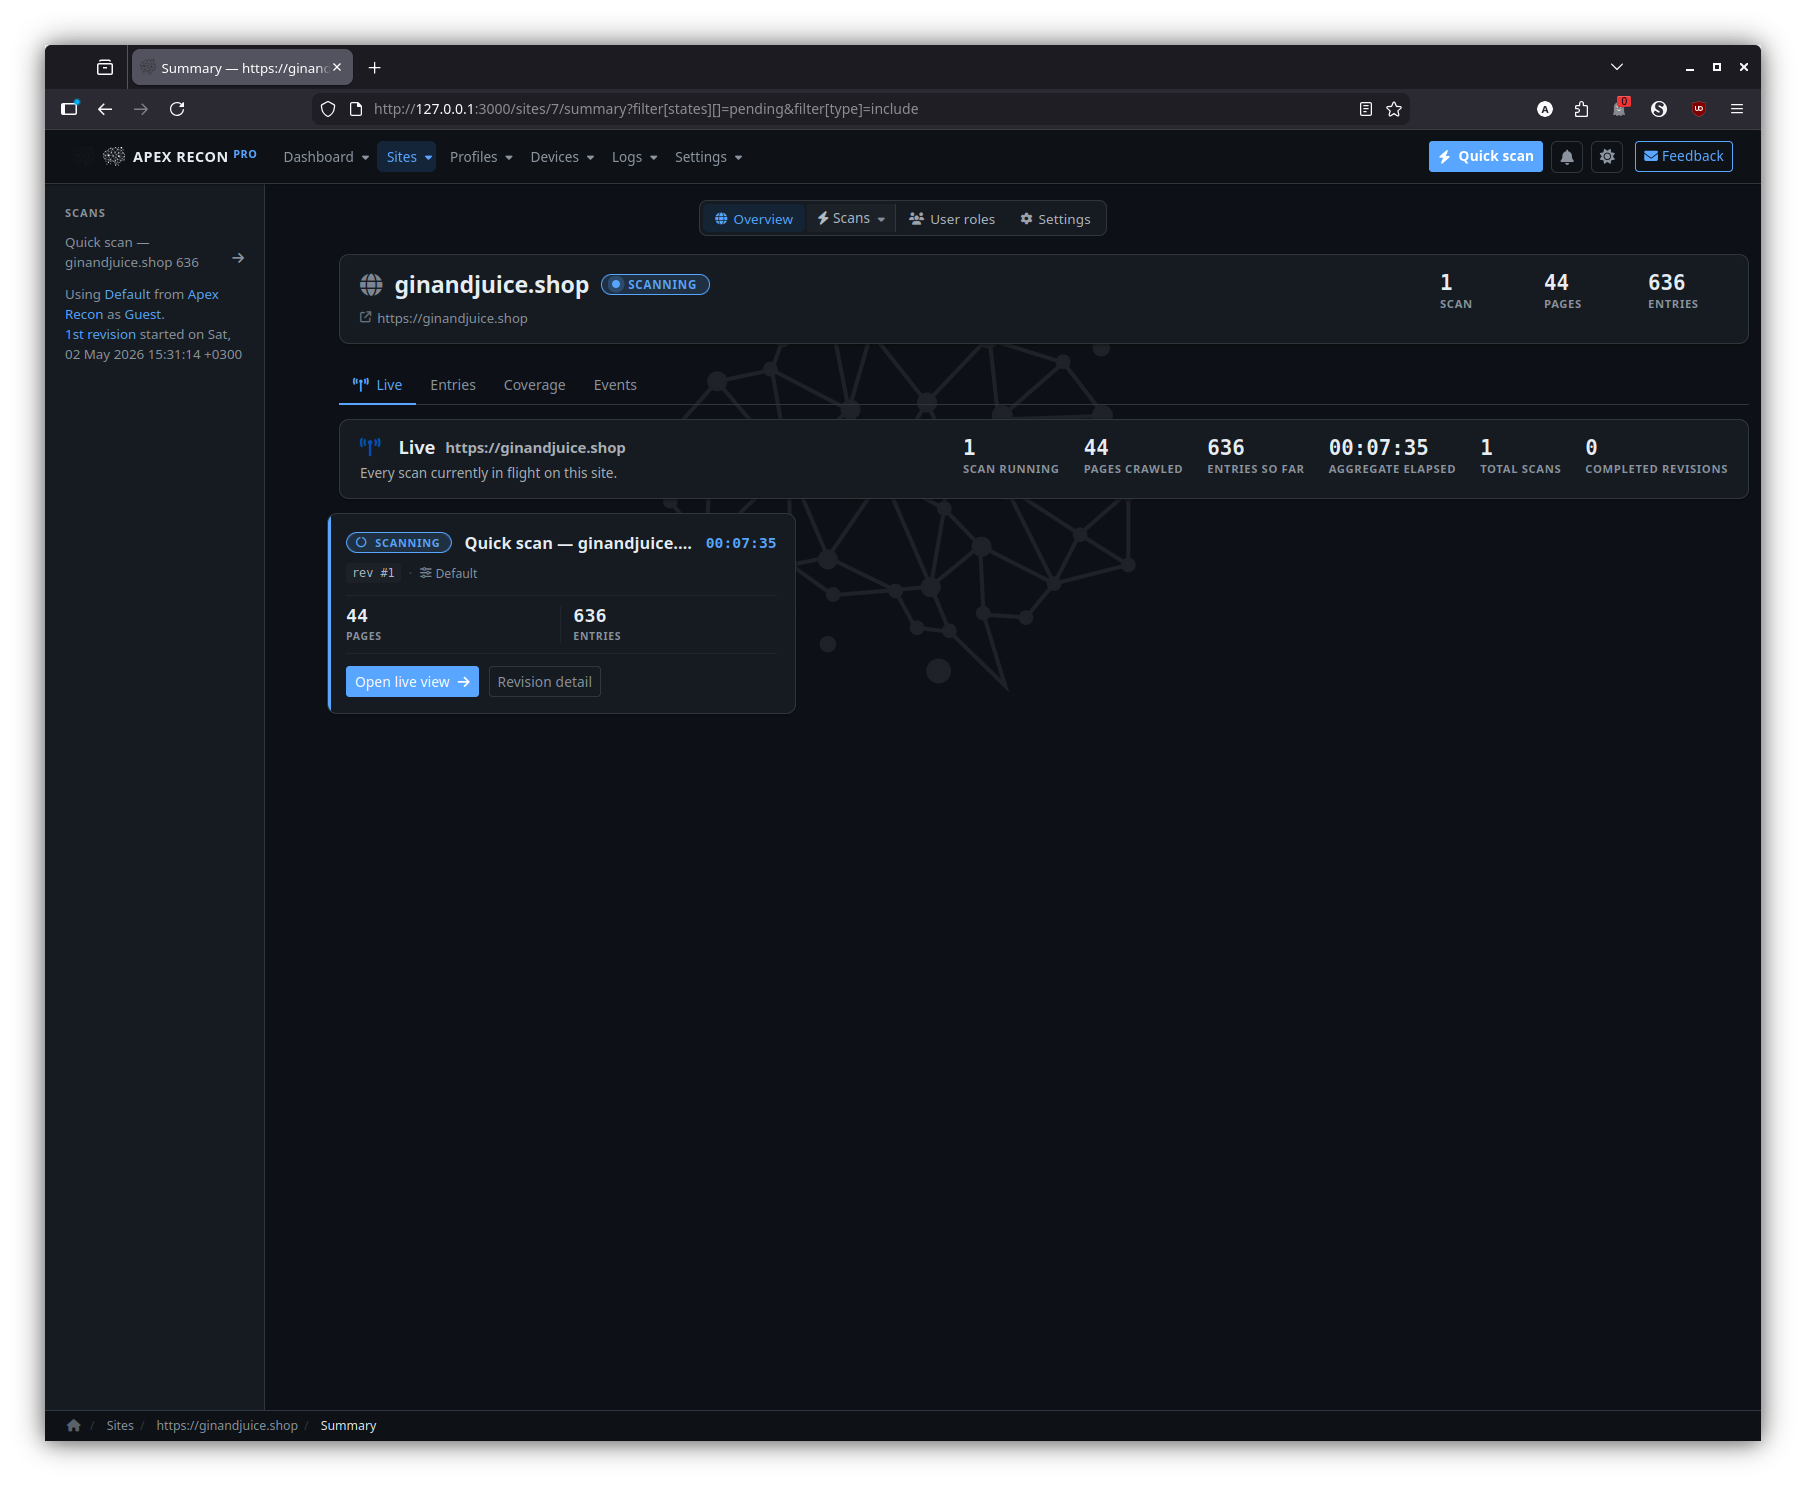
Site overview
The per-site landing page — a snapshot of recent revisions, entry totals and currently-running activity for that one site.
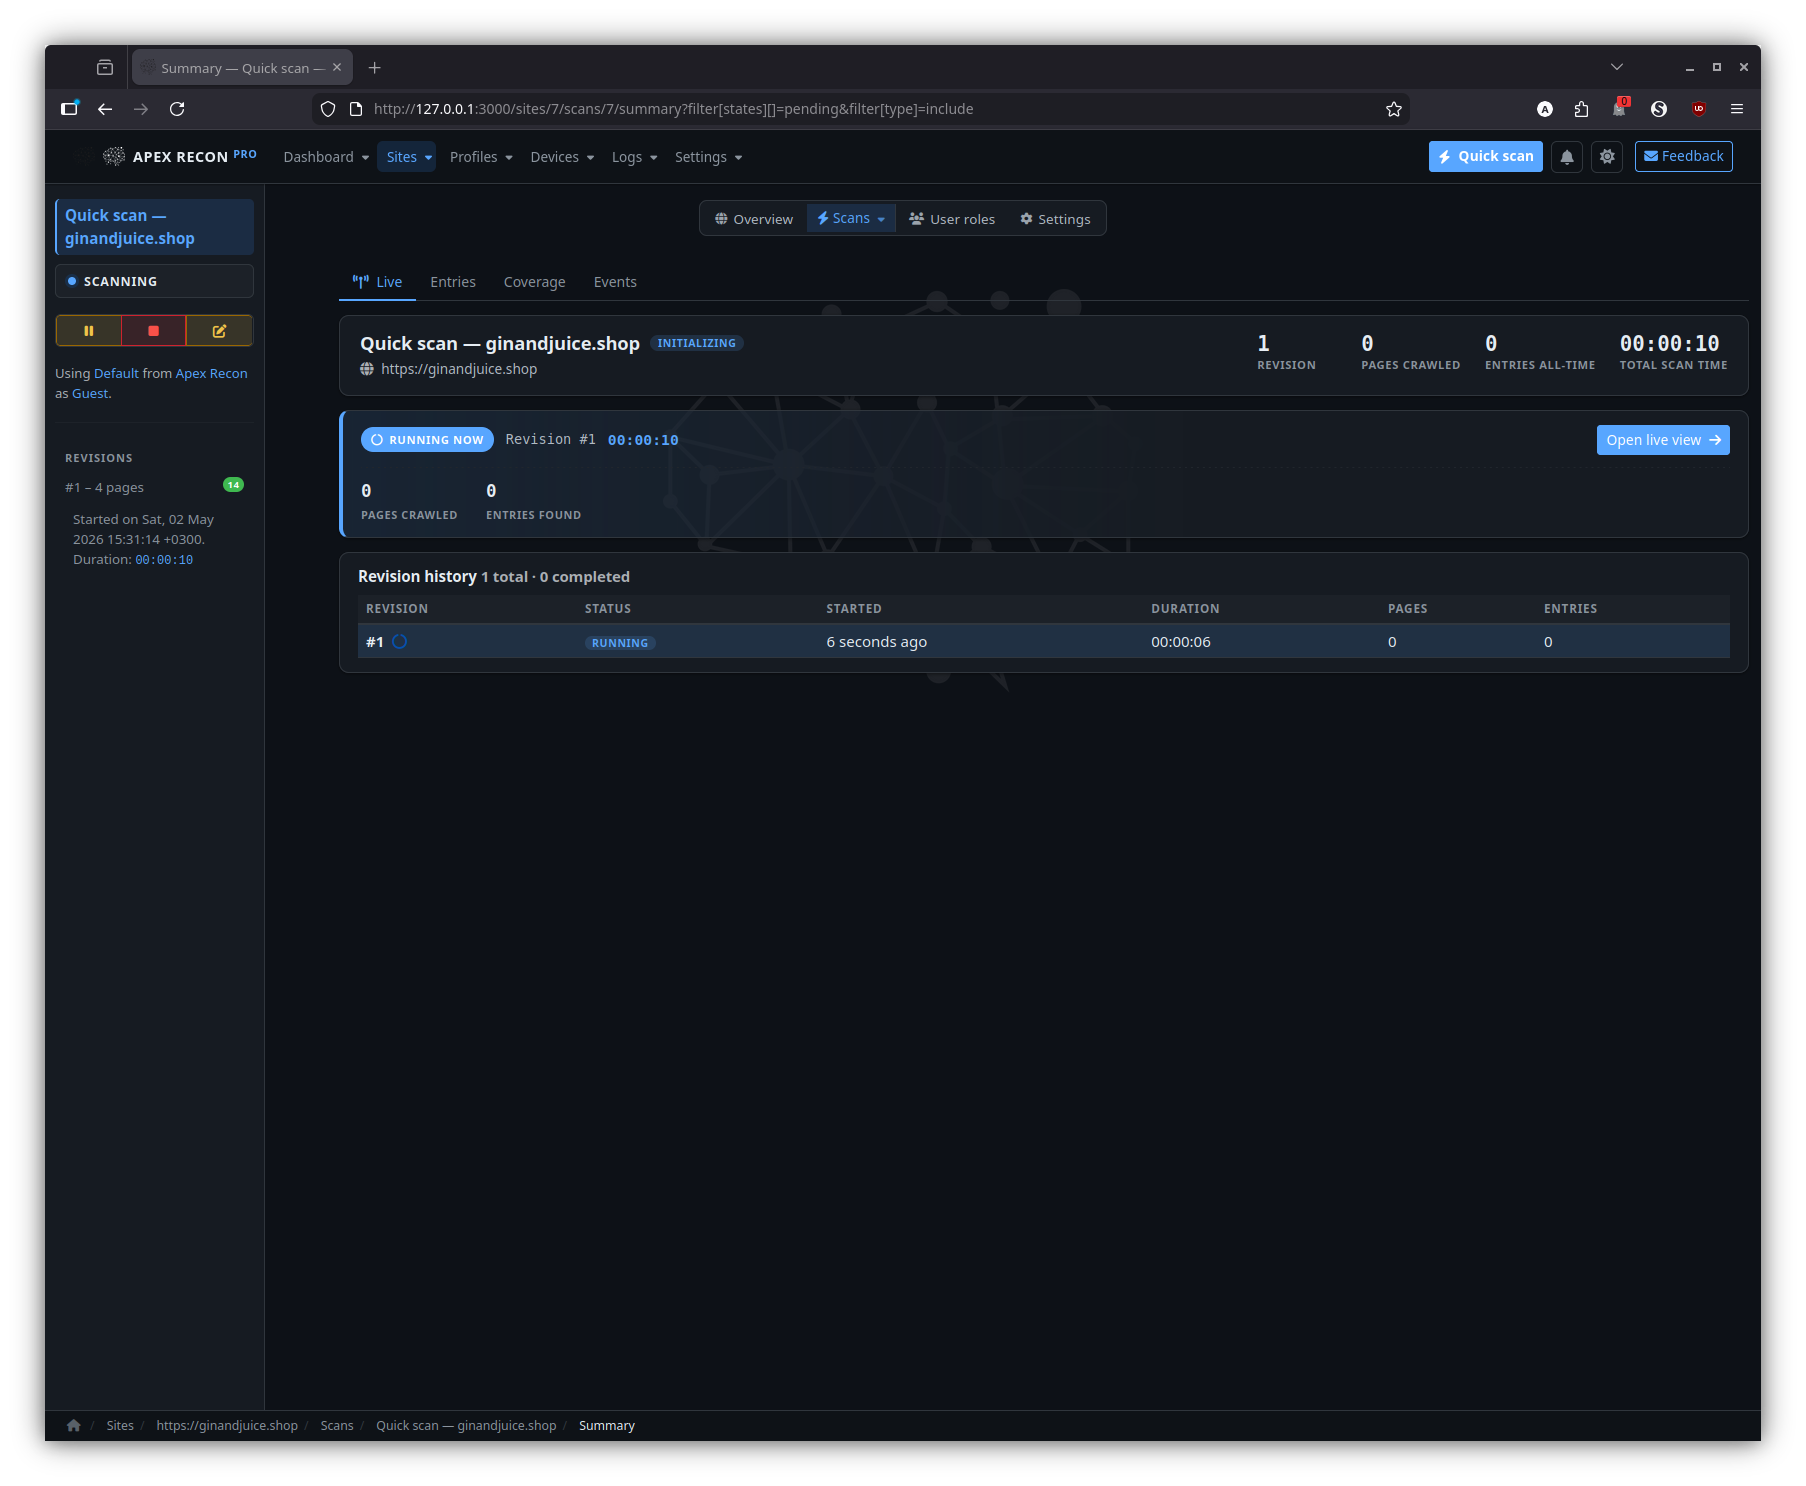
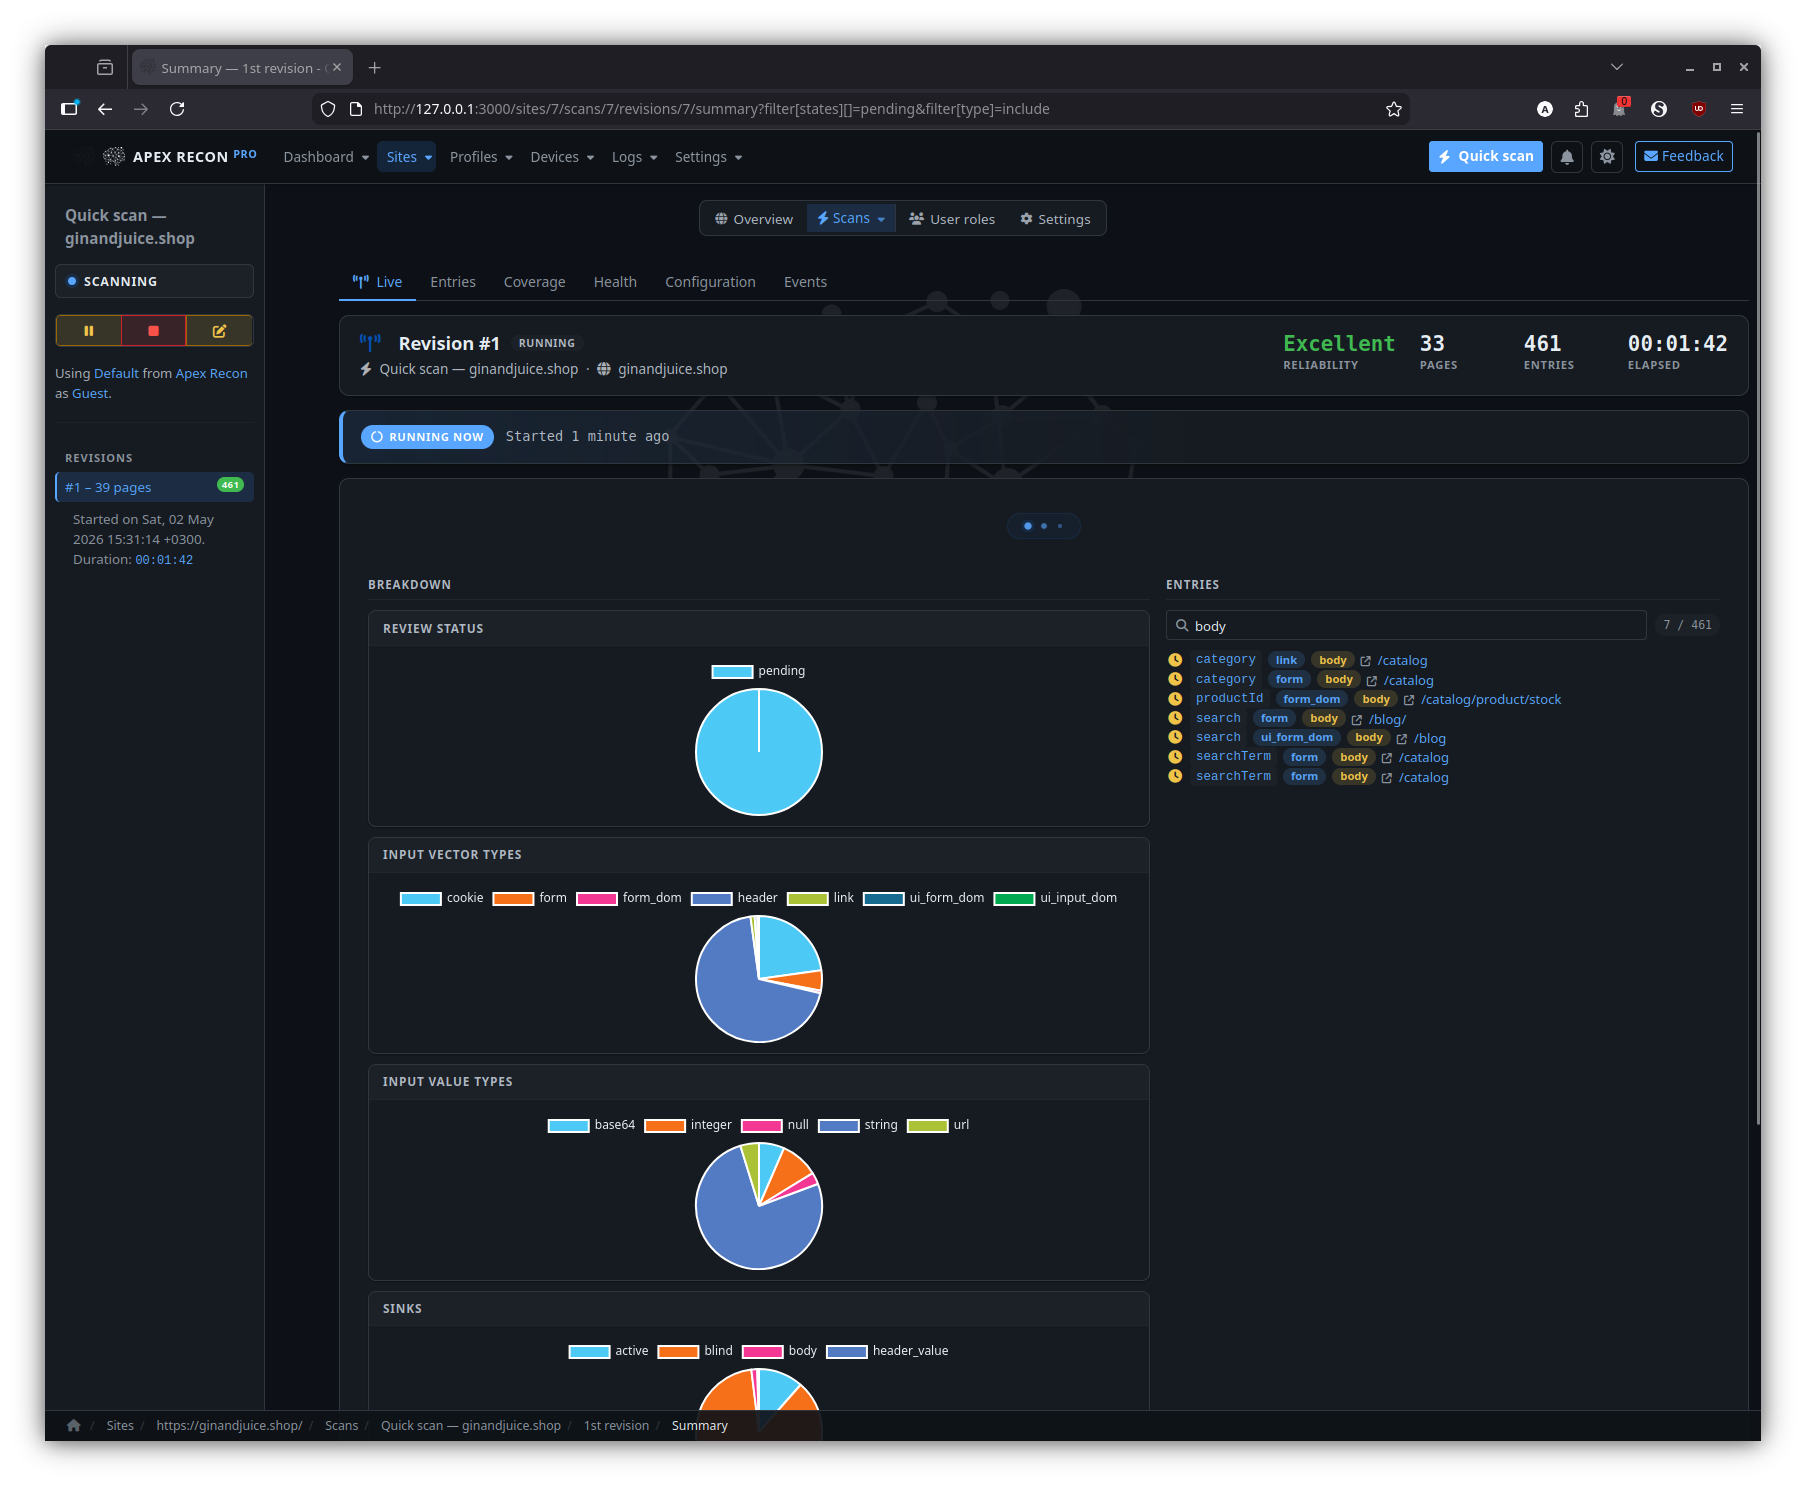
Scan
A specific scan inside a site, with its revision timeline, current status and a CTA into the live view.
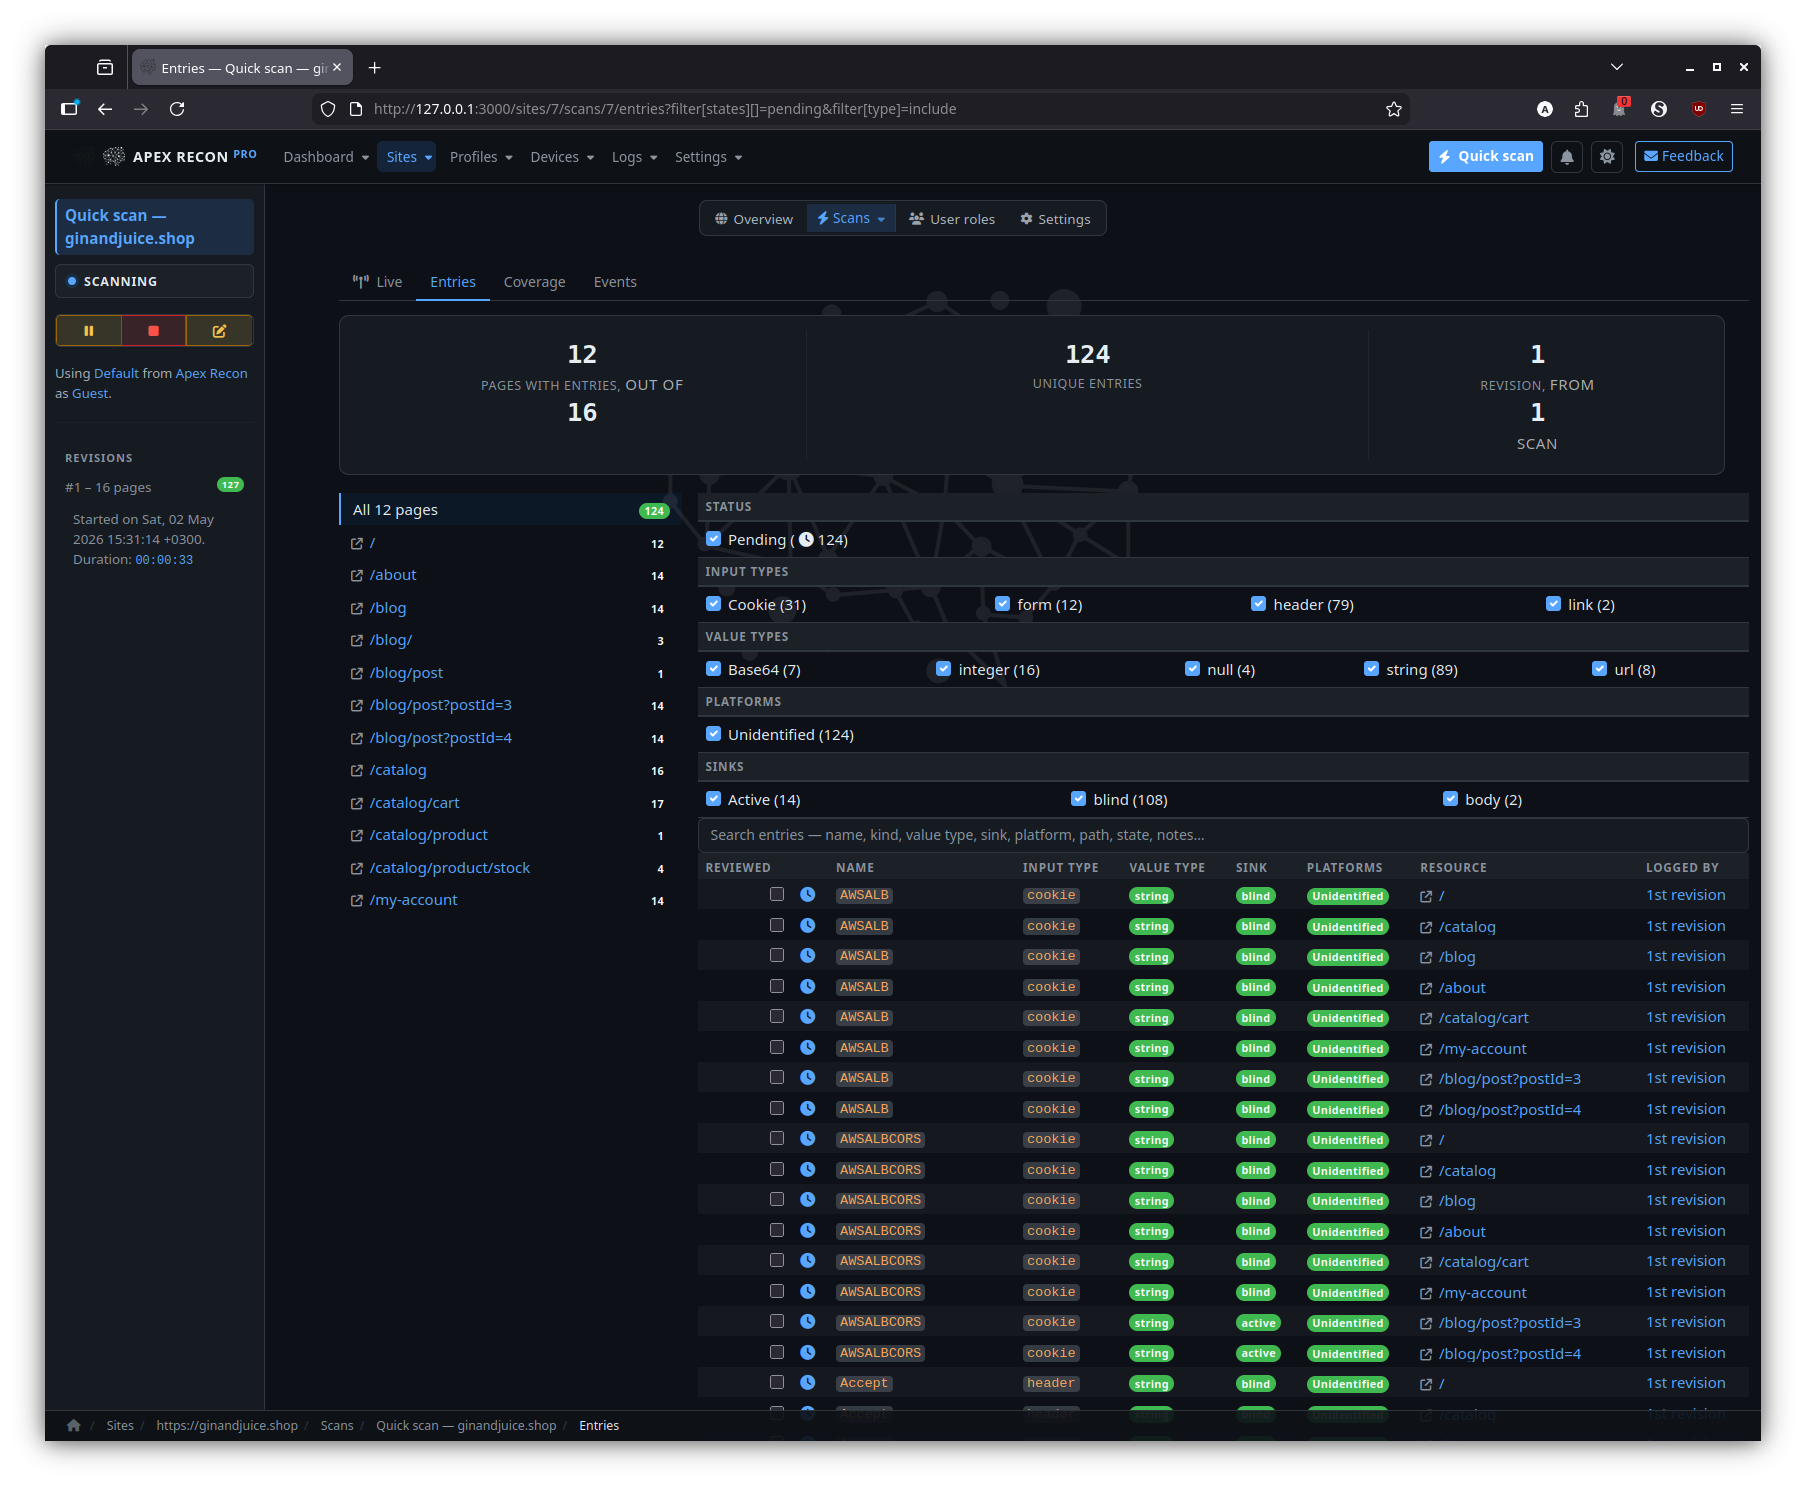
Entries
The entry listing for a site — every finding across every scan and revision, with state badges and click-through to detail.
Filtered
The same entry listing with state / type / URL filters applied; filters live in the URL so the view is shareable.
Revisions
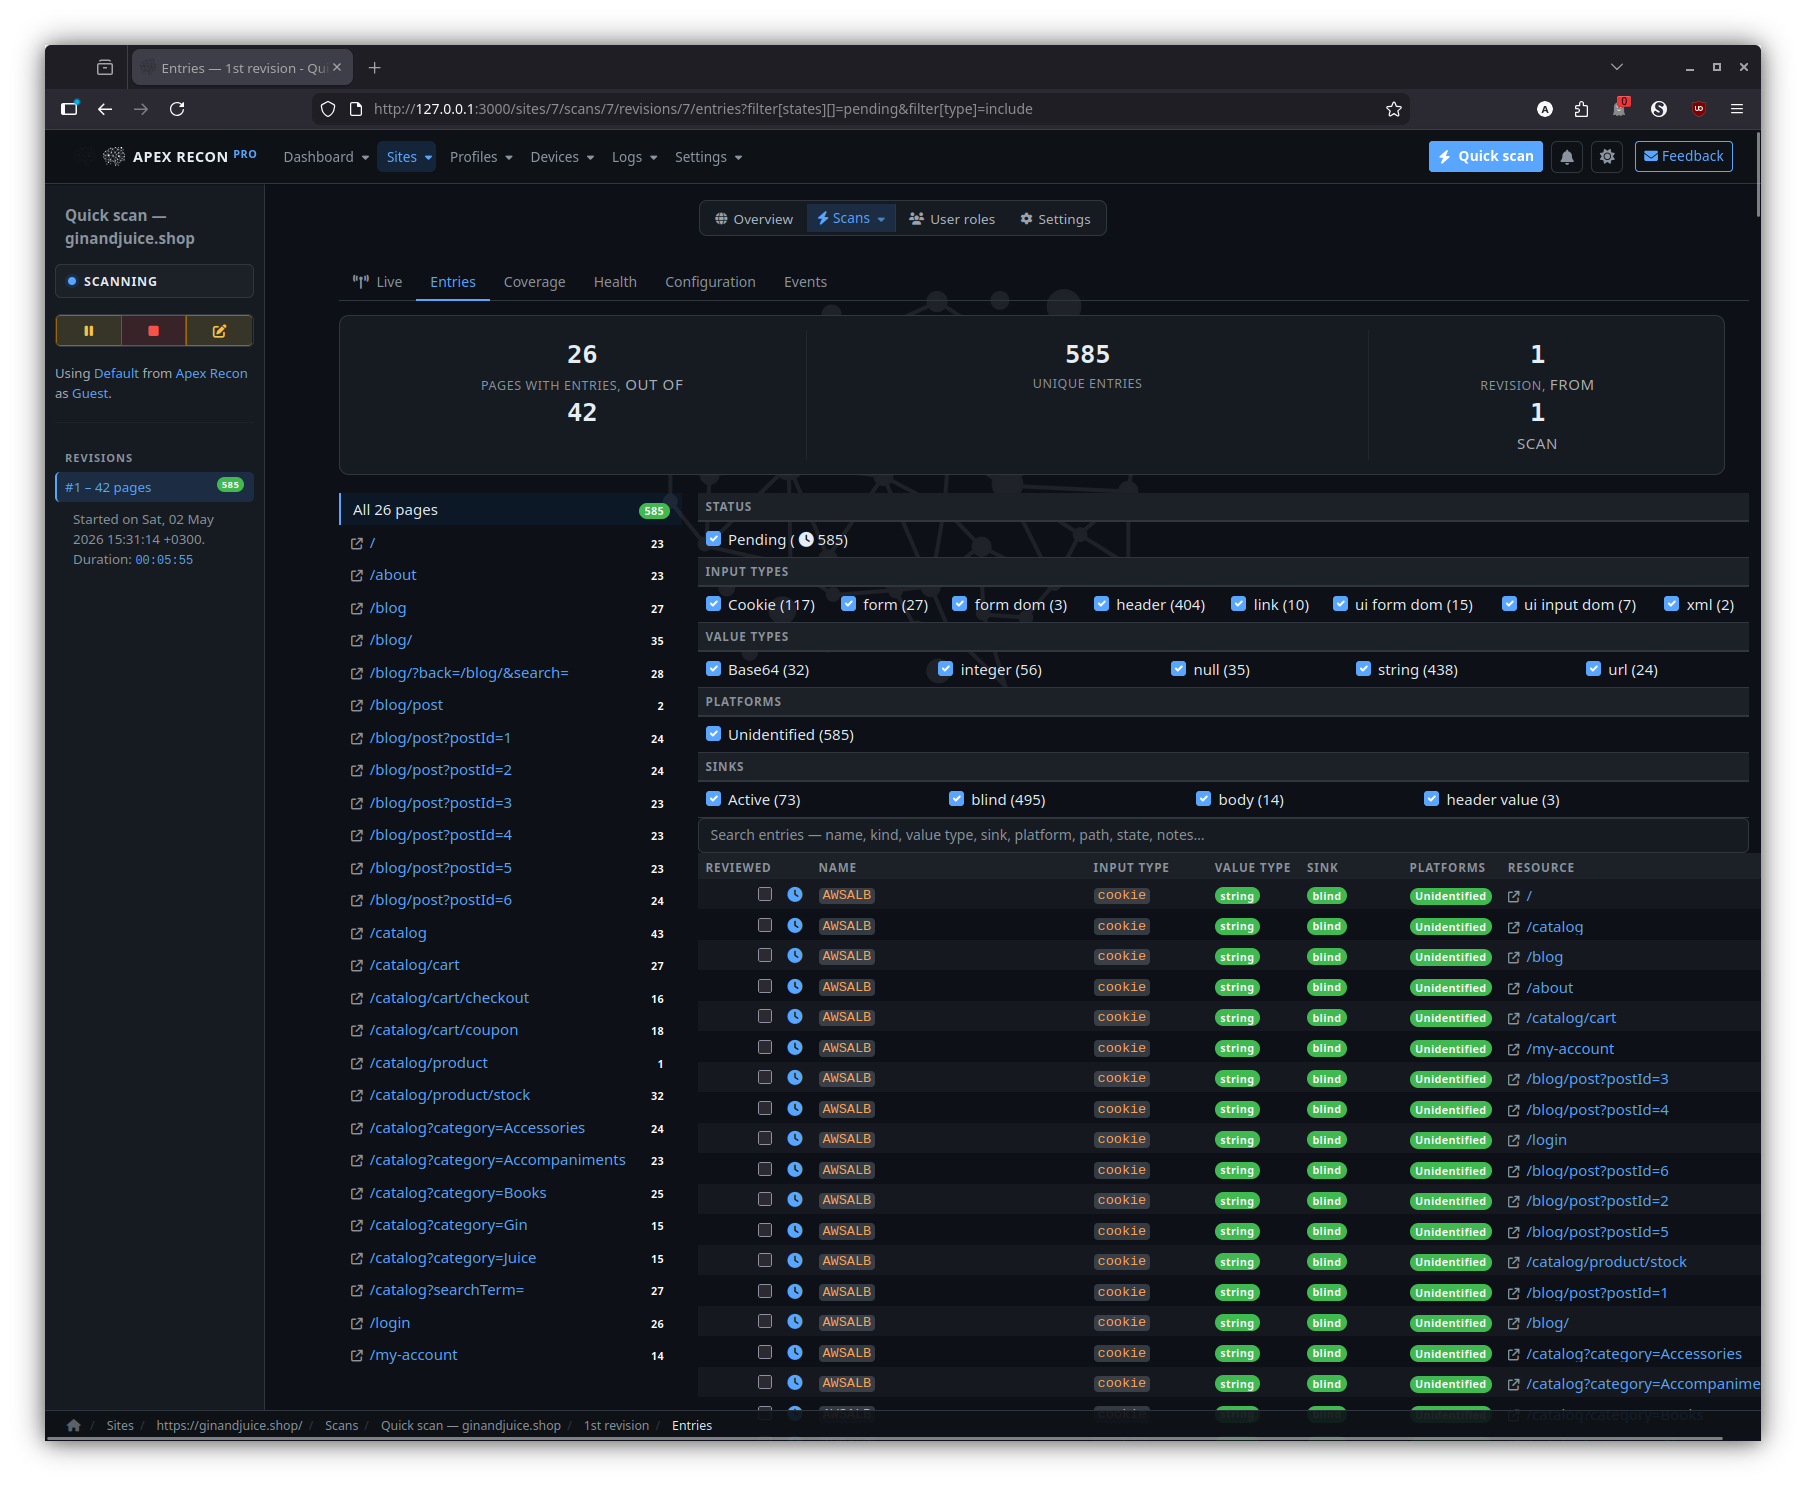
Entries
The entry listing scoped to a single revision, with state diffs against the previous revision baked in.
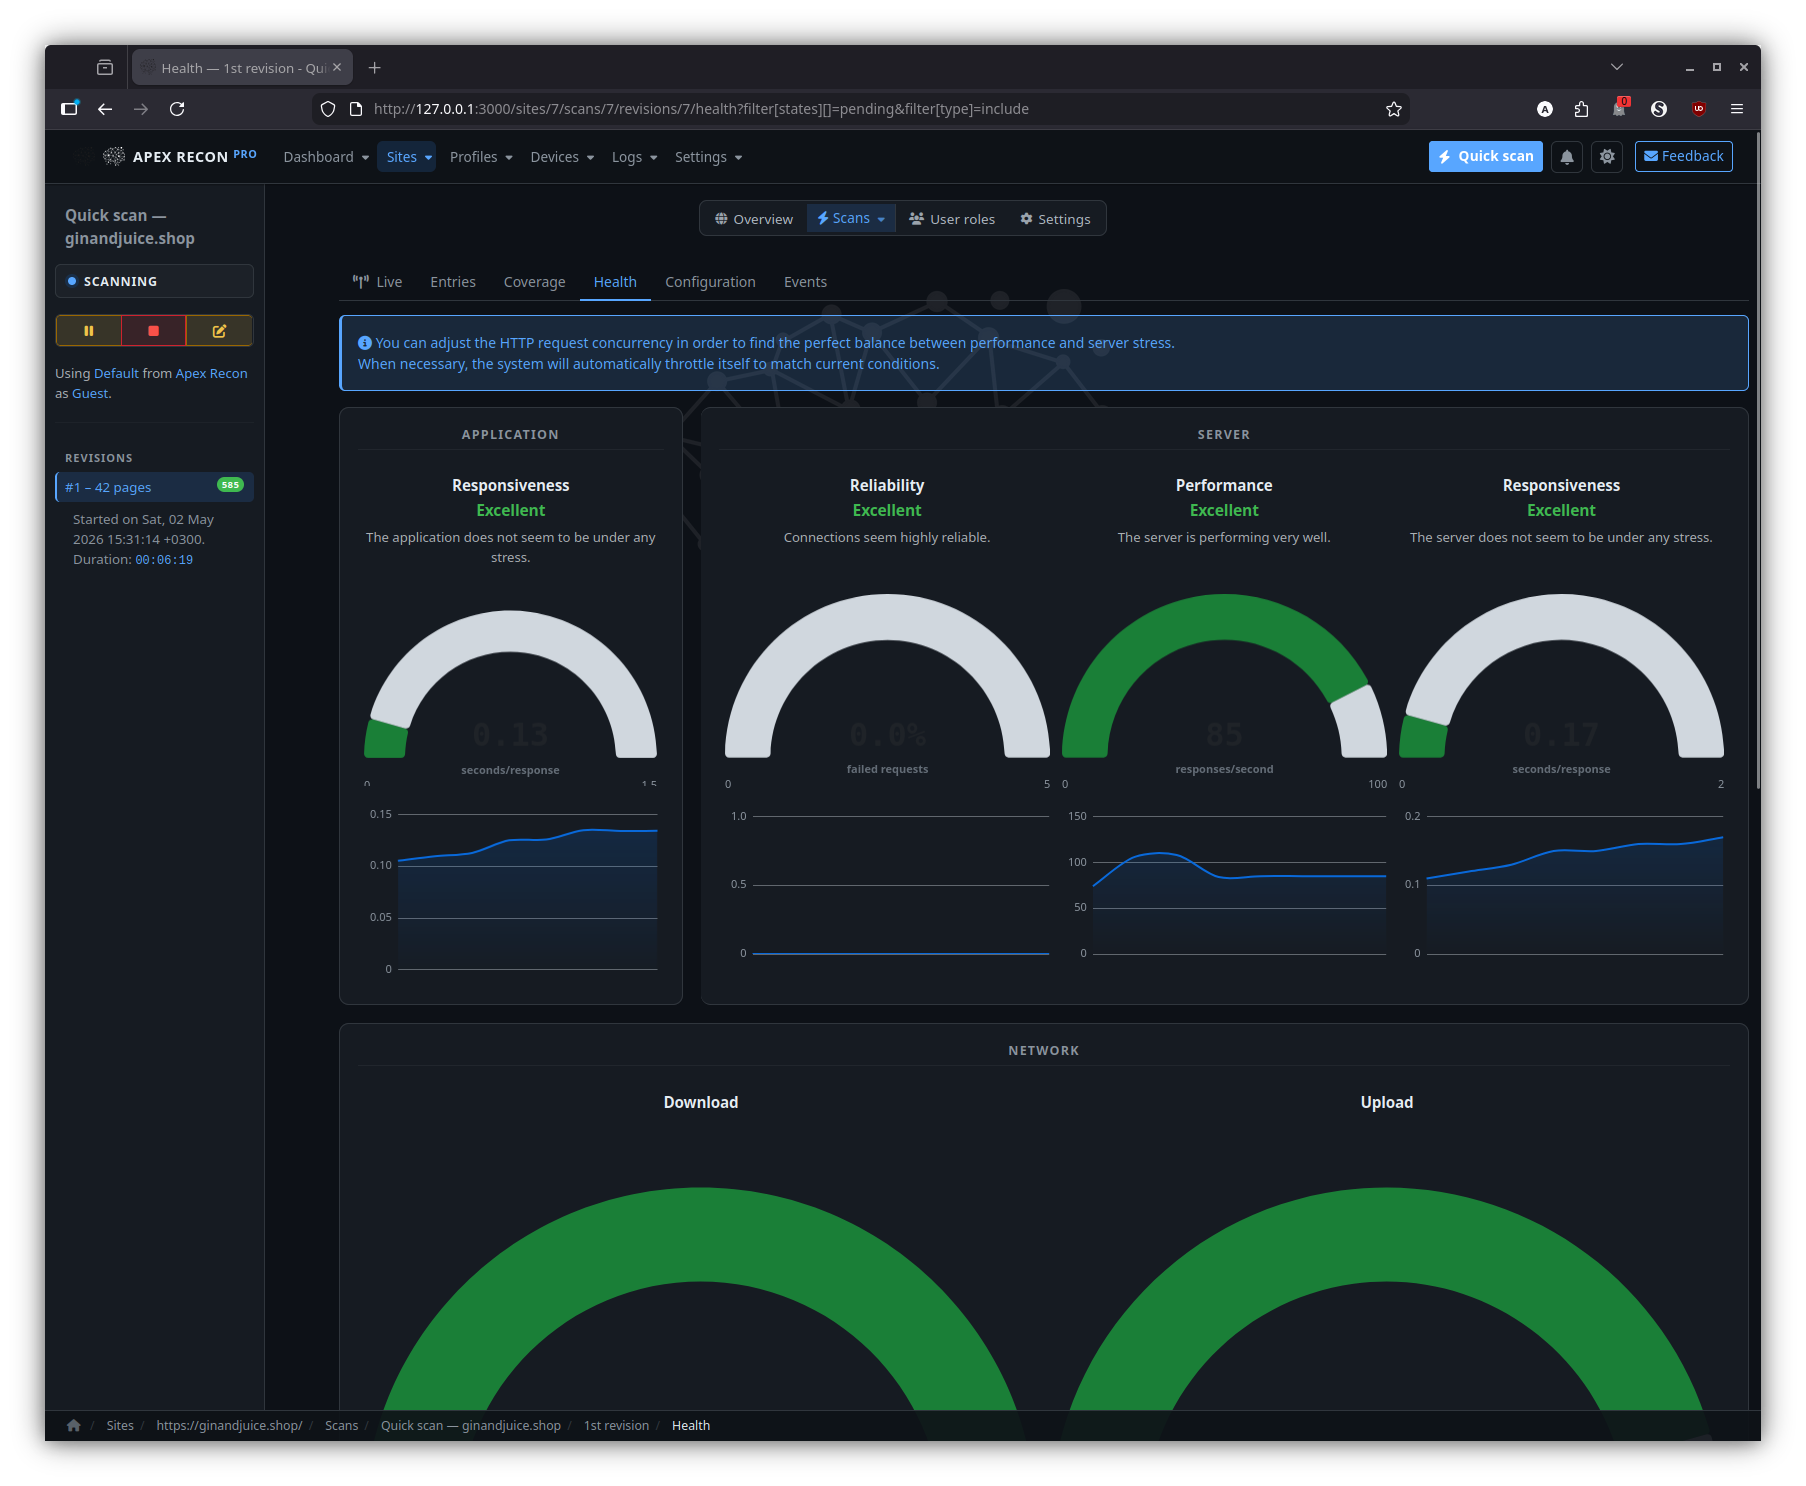
Health
Per-revision request rate, response times, browser-pool utilisation and error counts — handy when comparing two revisions of the same target.
Entry
Drill into an individual finding: page state, captured request / response, sink chain, recurring-scan state history.
Detail
State diff
For recurring scans: how this entry has changed across revisions — first-seen, fixed, regression, manual review state.
Sinks
The summary of every DOM data-flow sink reached during the entry’s capture, ordered by depth and grouped by sink kind.
Sink inspector
Step through the source-to-sink chain hop-by-hop. Each hop expands into its captured stack frame, surrounding source and the page snapshot at the moment of capture.
Djin! — AI assistant
Side-dock chat that streams via Action Cable, with page-aware grounding, scoped read tools and approval-gated write tools.
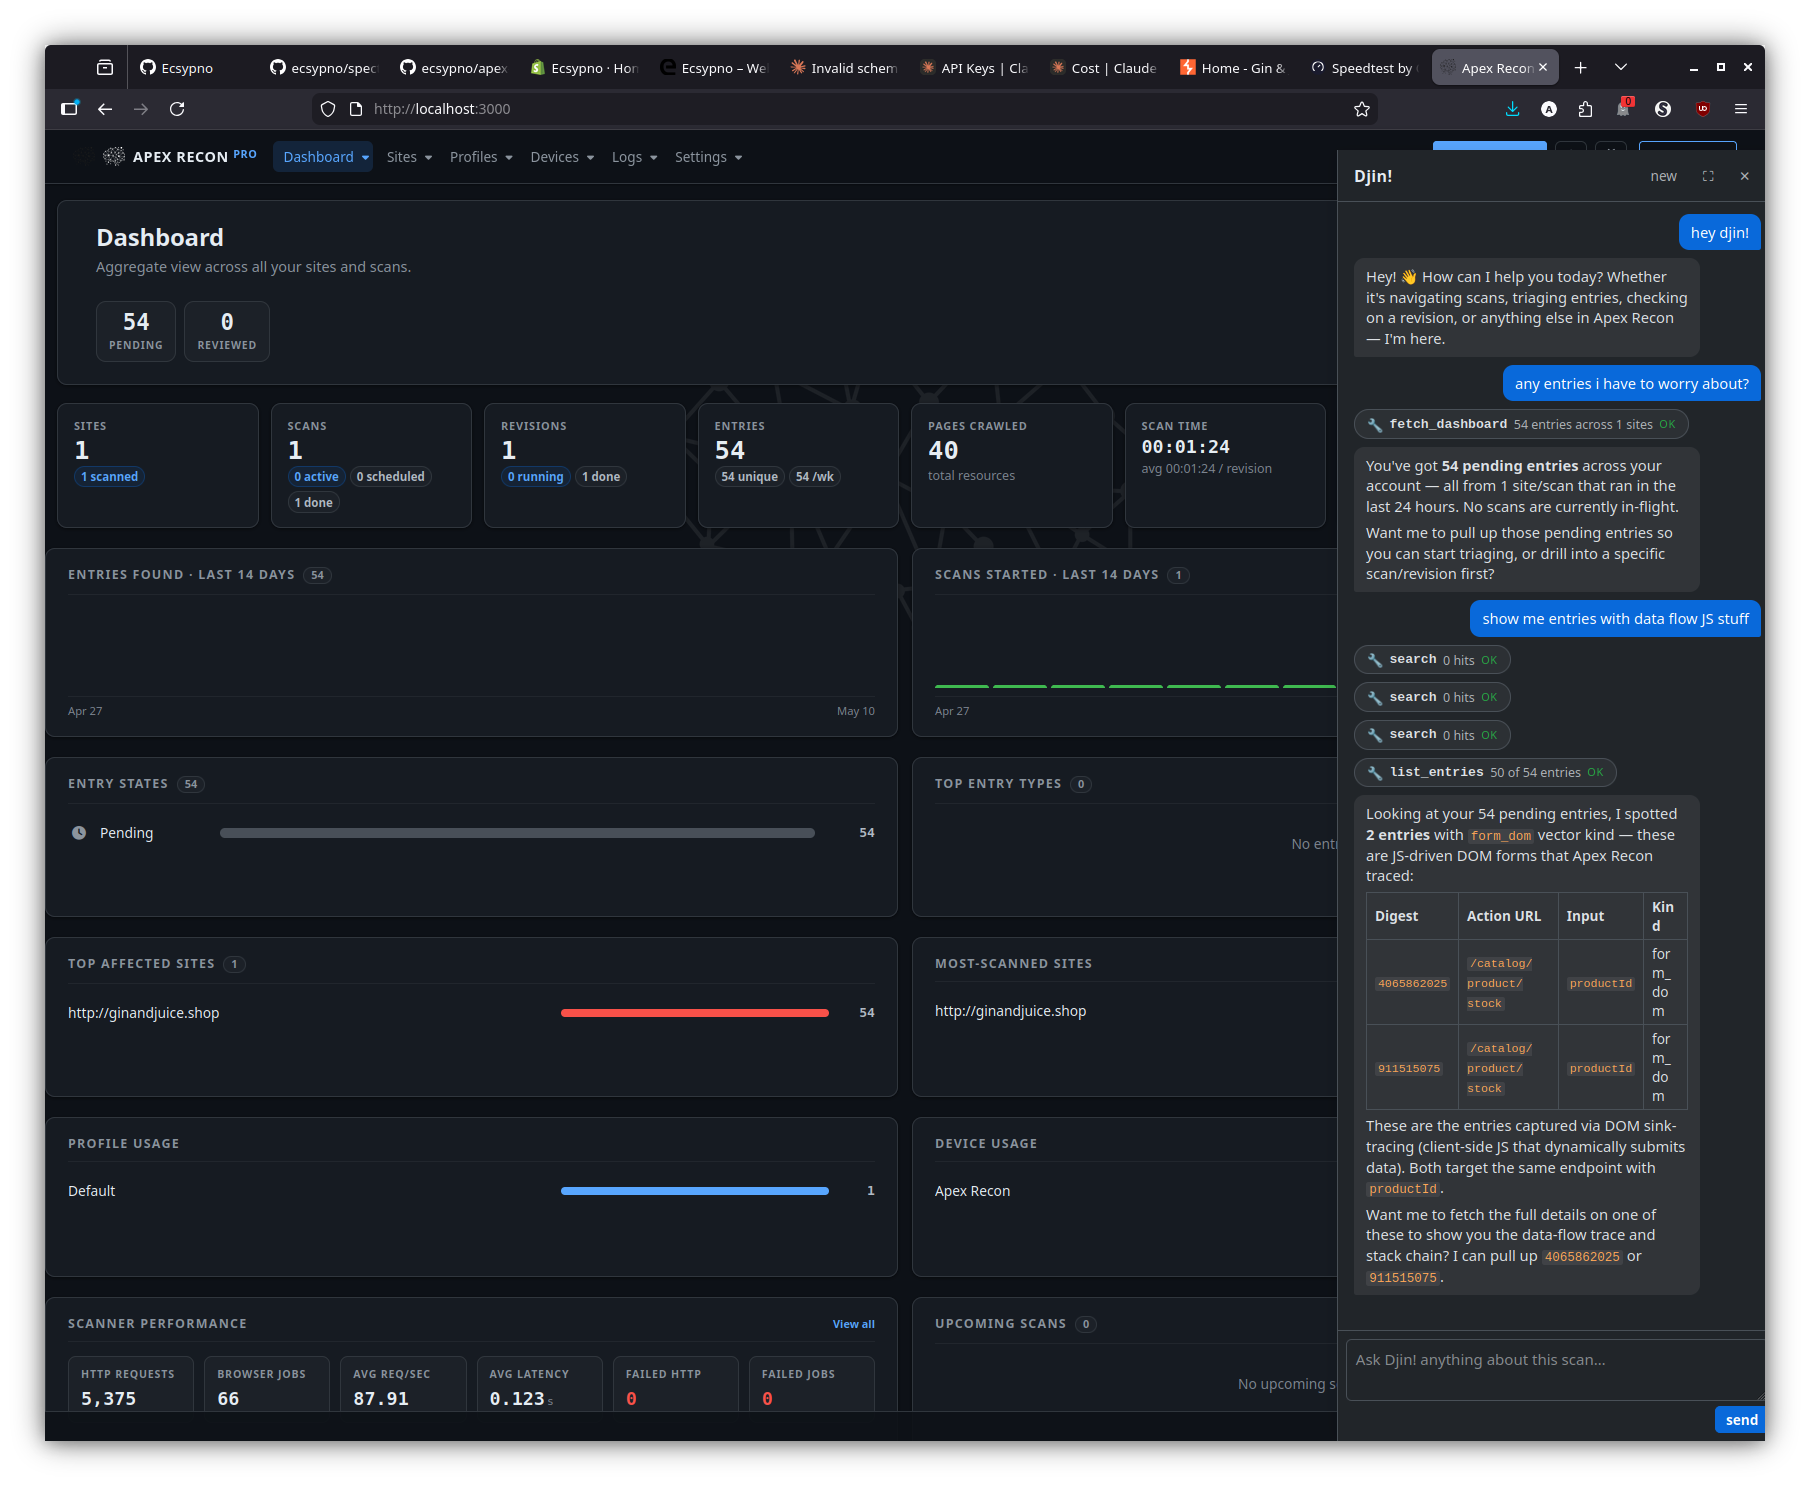
Page-aware answers — dashboard
Dock open against the dashboard; questions like “any entries I haven’t seen before?” are grounded against your sites and revisions, not a free-form recap.
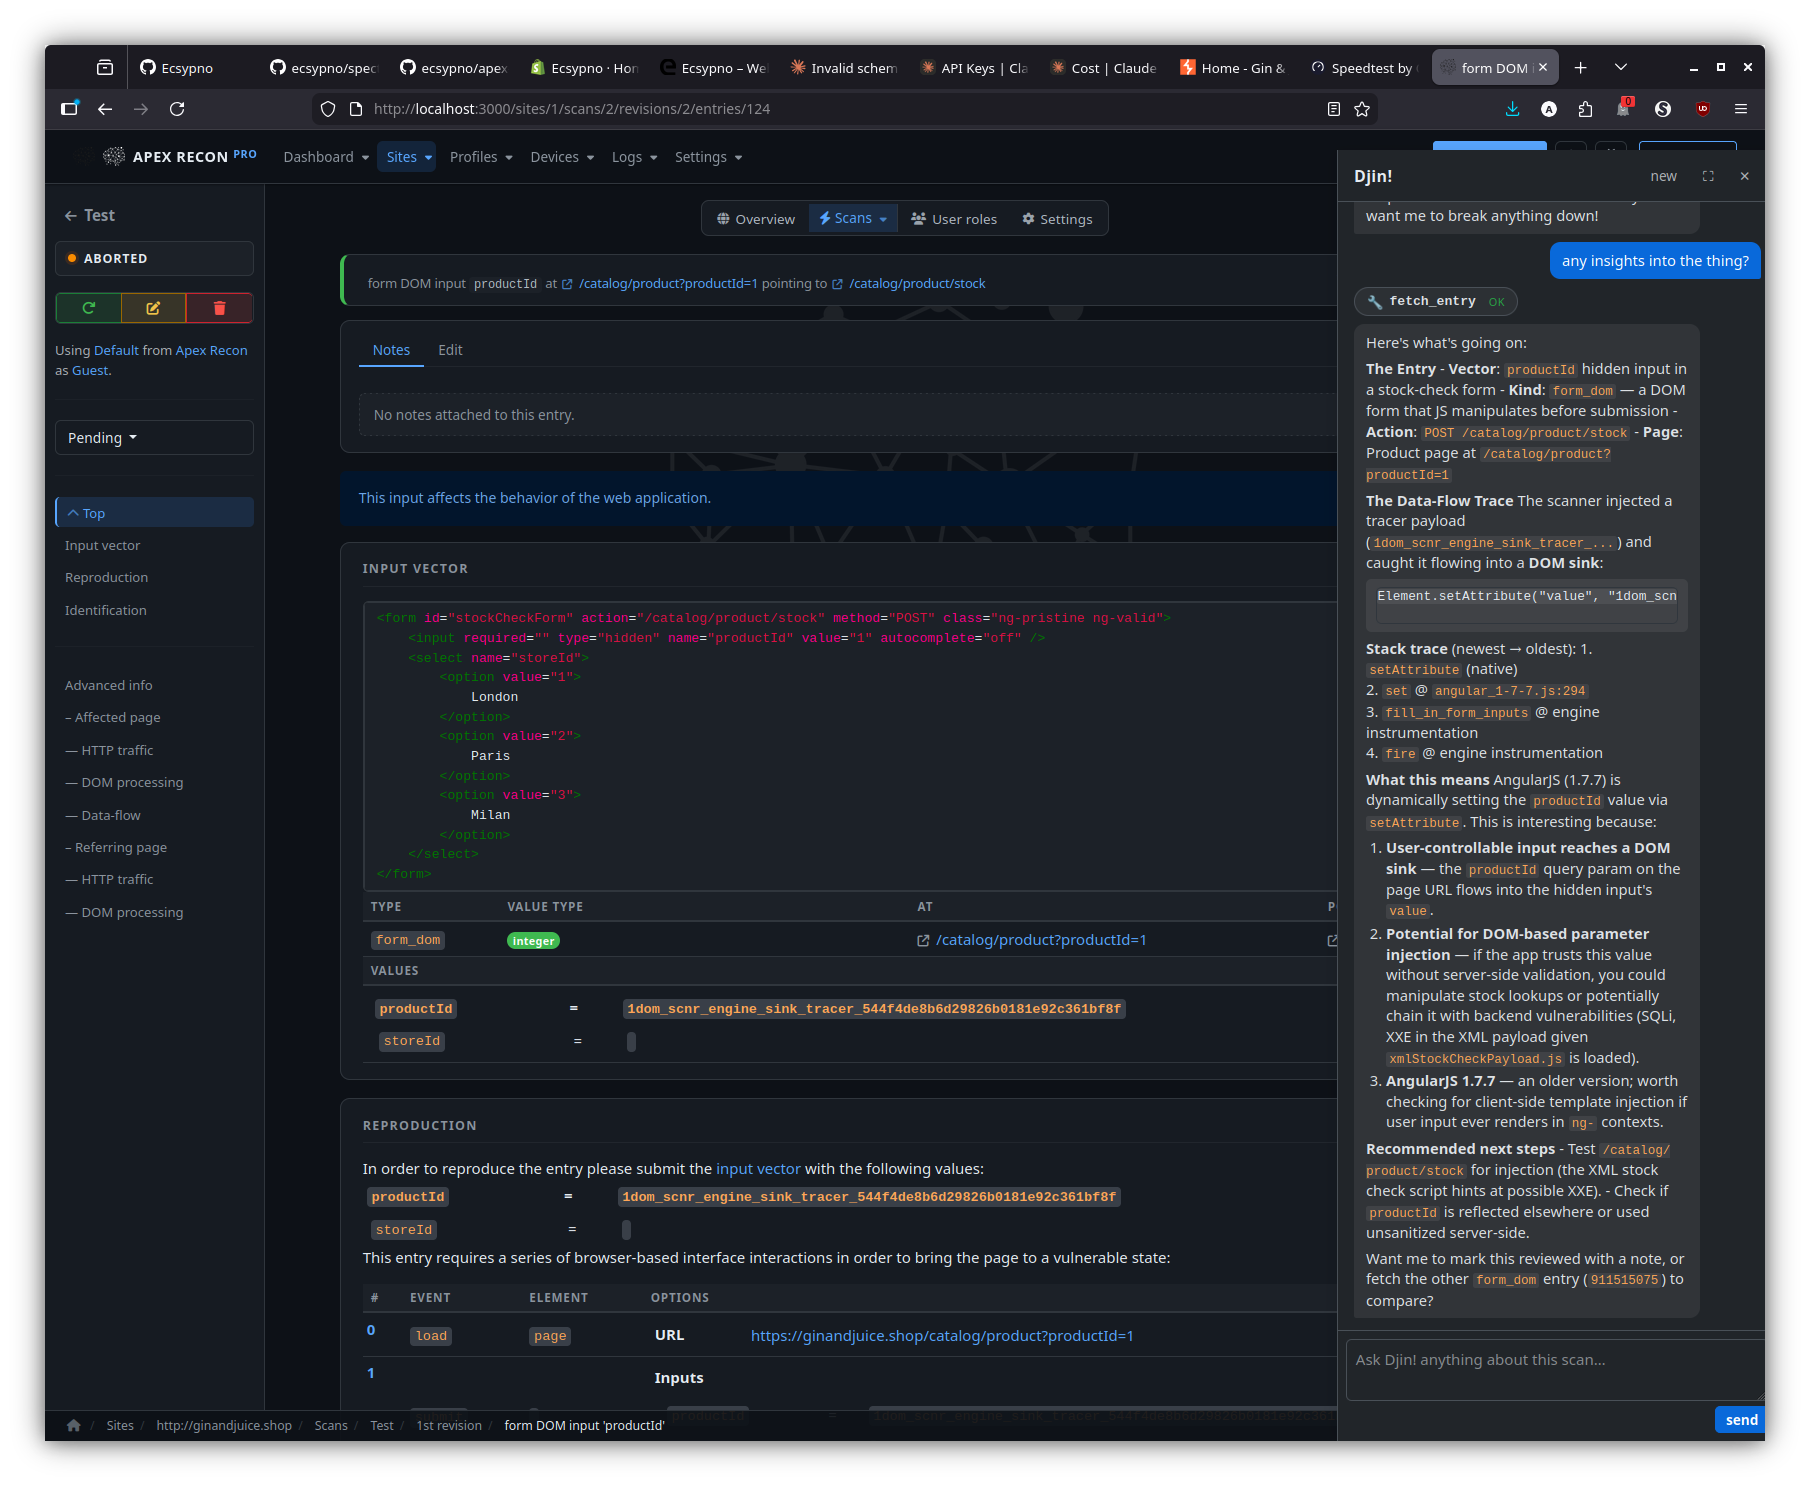
Page-aware answers — entry detail
On an entry page, the dock breaks down what makes the entry interesting — input vector, data-flow trace, recommended next step — against the captured stack frames and source.
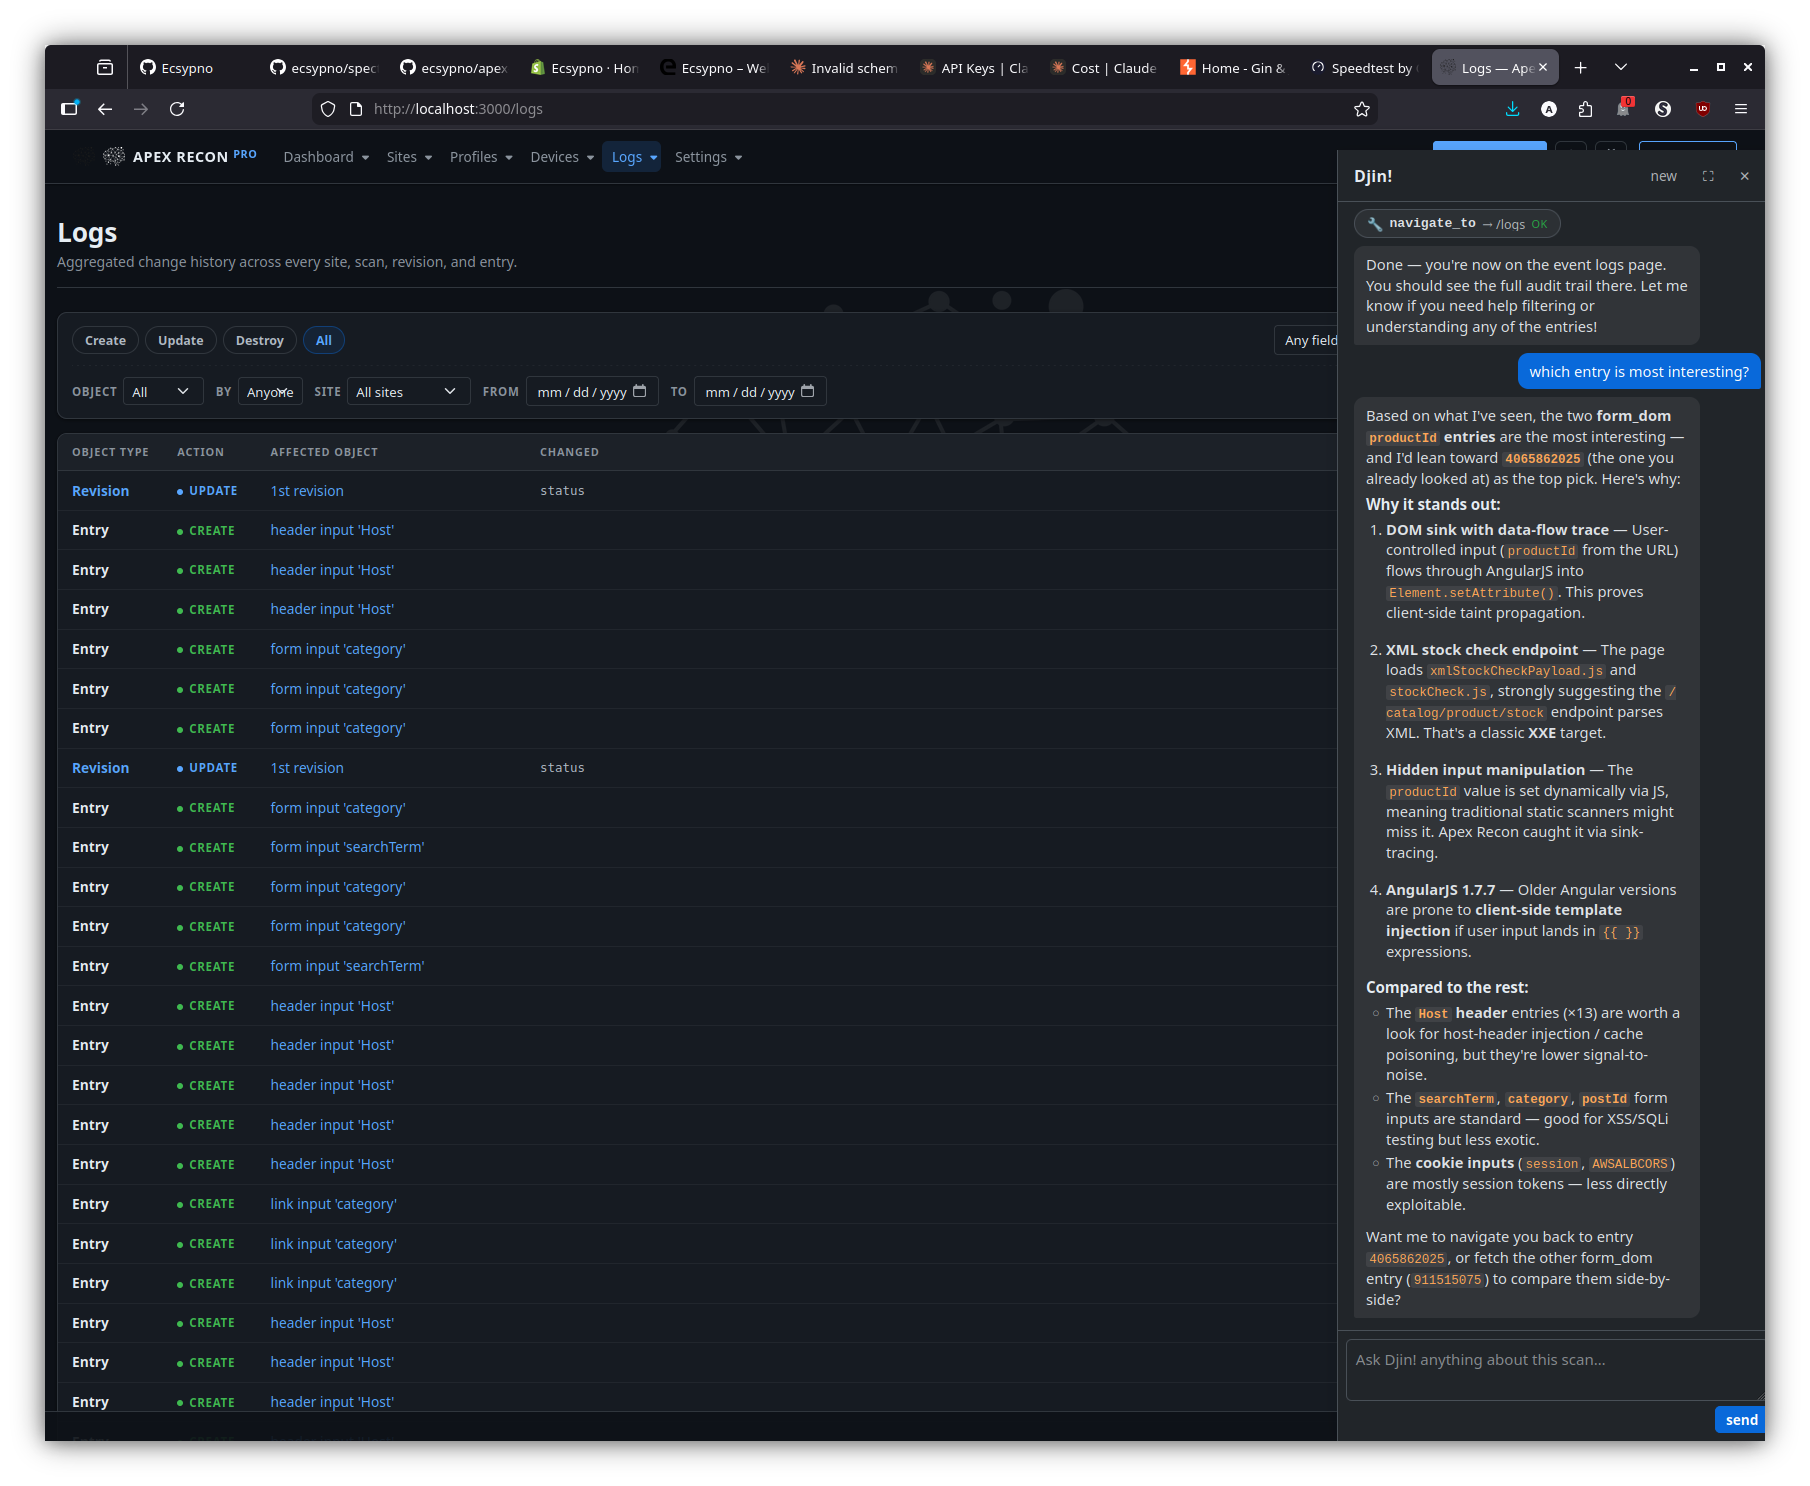
Page-aware answers — logs
On the logs page, the dock reasons over the visible event stream to surface the most-interesting entry / regression worth a human look.
Setup AI
Apex Recon integrates with two AI providers — pick whichever account you have credit on:
- OpenAI (openai.com) —
openaiprovider. - Anthropic Claude (anthropic.com)
—
claudeprovider.
Configuring a provider unlocks Djin! — the in-app side-dock chat assistant — across the Pro web UI. Apex’s domain is input-vector discovery (not security findings to triage as resolved), so there’s no per-record analysis plugin the way Spectre Scan ships one; configuring the AI key here enables only Djin!.
Web UI
In Settings → Djin! AI assistant:
- Pick a provider (OpenAI or Claude) from the dropdown.
- Paste your API key. Apex Recon Pro pings the provider on save to verify the key — invalid keys / billing issues / no model access surface as a precise error rather than a silent failure.
- Save.
That alone enables Djin!. Two extra controls in the same section tune behaviour:
- Djin! assistant — toggle. Off by default; flip on once the provider key validates. Off renders the dock as an empty “Djin! is disabled — enable in settings” hint instead of failing silently.
- Djin! daily token budget — per-user 24-hour cap on prompt
- completion tokens summed across every Djin! conversation
(default 500 000).
0disables the cap entirely.
- completion tokens summed across every Djin! conversation
(default 500 000).
What Djin! does
See the dedicated section in the
Pro features page
for the full surface — page-context grounding, the read tools
(list / fetch / search / events / sitemap / dashboard / …), the
write tools (mark_reviewed, scan lifecycle, quick_scan,
create_site_role, …) gated behind explicit Approve clicks, and
the PaperTrail audit-trail tagging that distinguishes
AI-driven mutations as whodunnit = "djin:<your_id>".
Run air-gapped
In order to run Apex Recon in an air-gapped environment you need to:
- Place the encrypted license file as
licenseinside~/.apex/(or$APEX_HOME/if you’ve overridden the home dir).- Either by copying it over from a previous activation on an Internet-enabled machine — copy
~/.apex/license(and, if present, the plaintext~/.apex/license.keynext to it), or; - by activating on-line.
- Either by copying it over from a previous activation on an Internet-enabled machine — copy
Optimize scans
Left to its own devices, Apex Recon will try to optimize itself to match any given circumstance, but there are limitations to what it can do automatically.
If a scan is taking too long, chances are that there are ways to make it go much faster by taking a couple of minutes to configure the system to closer match your needs.
In addition to performance, the following options also affect resource usage so you can experiment with them to better match your available resources as well.
- Ensure server responsiveness
- Balance RAM consumption and performance
- Reduce RAM consumption by avoiding large resources
- Don’t follow redundant pages
- Adjust the amount of browser workers
- Narrow recon to specific sink kinds
Ensure server responsiveness
By default, Apex Recon will monitor the response times of the server and throttle itself down if it detects that the server is getting stressed. This happens in order to keep the server alive and responsive and maintain a stable connection to it.
However, there are times with weak servers when they die before Apex Recon gets a chance to adjust itself.
You can bring up the scan statistics on the CLI screen by hitting Enter, in
which case you’ll see something like:
 [~] Currently auditing          http://testhtml5.vulnweb.com/ajax/popular?offset=0
 [~] Burst response time sum     6.861 seconds
 [~] Burst response count        29
 [~] Burst average response time 1.759 seconds
 [~] Burst average               0 requests/second
 [~] Original max concurrency    10
 [~] Throttled max concurrency   2
We can see that the server is having a hard time from the following values:
- Burst average: 3 requests/second
- Burst average response time 1.759
- Burst average: 0 requests/second
- Throttled max concurrency: 2
The response times were so high (1.75 seconds) that Apex Recon had to throttle its HTTP request concurrency from 10 requests to 2 requests, which would result in a drastically increased scan time.
You can lower the default HTTP concurrency and try again to make sure that the server at no point gets a stressful load:
--http-request-concurrency=5
Balance RAM consumption and performance
Most excessive RAM consumption issues are caused by large (or a lot of) HTTP requests, which need to be temporarily stored in memory in order for them to later be scheduled in a way that achieves optimal network concurrency.
To cut this short, having a lot of HTTP requests in the queue allows Apex Recon to be better at performing a lot of them at the same time, and thus makes better use of your available bandwidth. So, a large queue means better network performance.
However, a large queue can lead to some serious RAM consumption, depending on the website and type of audit and a lot of other factors.
As a compromise between preventing RAM consumption issues but still getting
decent performance, the default queue size is set to 50.
You can adjust this number to better suit your needs depending on the situation.
You can adjust the HTTP request queue size via the --http-request-queue-size option.
Reduce RAM consumption by avoiding large resources
Apex Recon performs a large number of analysis operations on each web page. This is usually not a problem, except for when dealing with web pages of large sizes.
If you are in a RAM constrained environment, you can configure Apex Recon to not download and analyze pages which exceed a certain size limit – by default, that limit is 500KB.
You can adjust the maximm allows size of HTTP response via the --http-response-max-size option.
Don’t follow redundant pages
A lot of websites have redundant pages like galleries, calendars, directory listings etc. which are basically the same page with the same inputs but just presenting different data.
Auditing the first (or first few) of such pages is often enough and trying to follow and audit them all can sometimes result in an infinite crawl, as can be the case with calendars.
Apex Recon provides 2 features to help deal with that:
- Redundancy filters: Specify
patternandcounterpairs, pages matching thepatternwill be followed the amount of times specified by thecounter.--scope-redundant-path-pattern
- Auto-redundant: Follow URLs with the same combinations of query parameters a
limited amount of times.
--scope-auto-redundant– Default is10.
Adjust the amount of browser workers
Apex Recon uses real browsers to support technologies such as HTML5, AJAX and DOM manipulation and perform deep analysis of client-side code.
Even though browser operations are performed in parallel using a pool of workers, the default pool size is modest and operations can be time consuming.
By increasing the amount of workers in the pool, scan durations can be dramatically shortened, especially when scanning web applications that make heavy use of client-side technologies.
Finding the optimal pool size depends on the resources of your machine (especially the amount of CPU cores) and will probably require some experimentation; on average, 1-2 browsers for each logical CPU core serves as a good starting point.
However, do keep in mind that more workers may lead to higher RAM consumption as they will also accelerate workload generation.
You can set this option via --dom-pool-size.
The default is calculated based on the amount of available CPU cores your system has.
Narrow recon to specific sink kinds
If you already know which class of finding you care about, restrict sink-tracing to that subset. Hits at filtered-out sinks are skipped at trace time, so they don’t pay the trace cost and they don’t bloat the report.
The five sink kinds are:
active— input reaches an exec-context sink (eval / Runtime.exec / SQL execute / innerHTML / DOM event handler). Highest leverage.body— value reflected verbatim into the response body (XSS / HTML-injection-shaped surfaces).header_name— value reflected into a response header NAME.header_value— value reflected into a response header VALUE.blind— input reaches a sink with no observable response signal (timing / out-of-band only).
The CLI defaults to the first four and skips blind because blind
hits are noise on most chatty targets. Override with
--sink-filter NAME (repeatable):
# Only exec-context findings — fastest narrowing for triage runs
bin/apex https://example.com/ --sink-filter active

# Add `blind` back to the default set
bin/apex https://example.com/ \
    --sink-filter active --sink-filter body \
    --sink-filter header_name --sink-filter header_value \
    --sink-filter blind
The first explicit --sink-filter flag clears the default;
subsequent flags accumulate. From an MCP client, pass the same
list as options.sinks_filter (omit the key to inherit the
four-kind default; pass [] for a crawl-only run that produces
just a sitemap). The web profile UI exposes the same toggles per
profile.
Maintain a valid session
Apex Recon supports automated logout detection and re-login, as well as improved login procedures.
login_form plugin
The login_form plugin expects for following options:
url– The URL containing the login form;parameters– A URL-query-like string of form parameters;check– A pattern to be matched against the response body after requesting the supplied URL in order to verify a successful login.
After a successful login, the plugin will configure the system-wide session manager and let it know of the procedure it needs to follow in order to be able to login automatically, in case it gets logged out during the scan or the session expires.
Hint: If the response of the form submission doesn’t contain the check,
you can set a different check URL via the global --session-check-url option,
this will also require that a --session-check-pattern be set as well (it can
be the same as the autologin check option).
Limitations
This plugin operates a browser just like a regular user would and is thus limited to the same extent.
For example, if the login form is by default hidden and requires a sequence of UI interactions in order to become visible, this plugin will not be able to submit it.
For more complex sequences please use the login_script plugin.
Example
bin/apex http://testfire.net --plugin=login_form:url=http://testfire.net/bank/login.aspx,parameters="uid=jsmith&passw=Demo1234",check="Sign Off|MY ACCOUNT" --scope-exclude-pattern=logout
The login form found in http://testfire.net/bank/login.aspx which contains the
uid and passw inputs will be updated with the given values and submitted.
After that, the response will be matched against the check pattern – which will
also be used for the duration of the scan to check whether or not the session is still valid.
(Since the “Sign Off” and “MY ACCOUNT” strings only appear when the user is logged-in, they are a reliable way to check the validity of the session.)
Lastly, we exclude (--scope-exclude-pattern) the logout link from the audit in order to avoid getting logged out.
login_script plugin
The login_script plugin can be used to specify custom login procedures, as simple
Ruby or JS scripts, to be executed prior to the scan and each time a logout is detected.
The script will be run under the context of a plugin, which means that it will have access to all system components, allowing you to login in the most optimal way – be that via a real browser, via HTTP requests, by loading an external cookie-jar file and many more.
With browser
If a browser is available, it will be exposed to the script
via the browser variable. Otherwise, that variable will have a value of nil.
If you require access to Selenium, browser.wd will provide you access to the appropriate WebDriver.
browser.goto 'http://testfire.net/bank/login.aspx'

form = browser.form( id: 'login' )
form.text_field( name: 'uid' ).set 'jsmith'
form.text_field( name: 'passw' ).set 'Demo1234'

form.submit

# You can also configure the session check from the script, dynamically,
# if you don't want to set static options via the user interface.
SCNR::Engine::Options.session.check_url     = browser.url
SCNR::Engine::Options.session.check_pattern = /Sign Off|MY ACCOUNT/
With HTTP Client
If a real browser environment is not required for the login operation, then using the system-wide HTTP interface is preferable, as it will be much faster and consume much less resources.
response = http.post( 'http://testfire.net/bank/login.aspx',
    parameters:     {
        'uid'   => 'jsmith',
        'passw' => 'Demo1234'
    },
    mode:           :sync,
    update_cookies: true
)

SCNR::Engine::Options.session.check_url     = to_absolute( response.headers.location, response.url )
SCNR::Engine::Options.session.check_pattern = /Sign Off|MY ACCOUNT/
From cookie-jar
If an external process is used to manage sessions, you can keep Apex Recon in sync by loading cookies from a shared Netscape-style cookie-jar file.
http.cookie_jar.load 'cookies.txt'
Advanced session check configuration
In addition to just setting the check_url and check_pattern options, you can
also set arbitrary HTTP request options for the login check, to cover cases where
extra tokens or a method other than GET must be used.
framework.session.check_options = {
    # :get, :post, :put, :delete
    method:     :post,

    # URL query parameters.
    parameters: {
        'param1' => 'value'
    },

    # Request body parameters -- can also be a String instead of Hash.
    body:       {
        'body_param1' => 'value'
    },

    cookies:    {
        'custom_cookie' => 'value'
    },

    headers:    {
        'X-Custom-Header' => 'value'
    }
}
Proxy plugin
The proxy plugin can be used to train the system by inspecting the traffic
exchanged between the browser and the web application. From that traffic, it can
extract input vectors like links, forms and cookies from both sides – i.e. from
server responses as well as browser requests.
Since the proxy can inspect all this traffic, it can be instructed to record a login sequence and then deduce the login form and the values with which it was filled.
Like the form_login plugin, the proxy plugin will configure the system accordingly.
Example
bin/apex http://testfire.net --plugin=proxy --scope-exclude-pattern=logout
You then need to configure your browser to use this proxy when connecting to the webapp, press the record button just before logging in and the stop button after.
You’ll then be presented with a simple wizard which will guide you through configuring a login check and verifying that the deduced login sequence works properly.
Lastly, we exclude (--scope-exclude-pattern=logout) the logout link from the audit in order to avoid getting logged out.
Cookie-jar
If the aforementioned techniques don’t work for you, you can pass a cookie-jar and manually configure the login-check using the following options:
--http-cookie-jar--session-check-url--session-check-pattern
This way Apex Recon will still be able to know if it gets logged out (which is helpful to several system components) but won’t be able to log-in automatically.
Of course, you should still exclude any path that can lead to the destruction of the session.
Generate reports
Pro
You can export scan results in several formats from the “Export” tab of an aborted or completed revision scan.
CLI
There are 2 reference report format types that you may encounter when using Apex:
*.crf– Cuboid report file.*.aer– Apex report.
Both of these files can be handled by the CLI apex_reporter utility in order
to convert them to a multitude of formats or print the results to STDOUT.
For example, to generate an HTML report:
bin/apex_reporter --report=html:outfile=my_report.html.zip /home/user/.apex/reports/report.aer
Or, to just print the report to STDOUT:
bin/apex_reporter --report=stdout /home/user/.apex/reports/report.aer
At the time of writing, bin/apex_reporter --reporters-list yields:
 [~] Available reports:

 [*] ap:
--------------------
Name:           AP
Description:
Awesome prints a scan report hash.

Author:         Tasos "Zapotek" Laskos <[email protected]>
Version:        0.1.1
Path:   /home/zapotek/workspace/rkn/application/components/reporters/ap.rb

 [*] html:
--------------------
Name:           HTML
Description:
Exports the sink-trace entries as a compressed HTML report.

Options:
 [~]    outfile - Where to save the report.
 [~]    Type:        string
 [~]    Default:     2026-06-04_11_40_13_+0300.html.zip
 [~]    Required?:   false

Author:         Tasos "Zapotek" Laskos <[email protected]>
Version:        0.5.0
Path:   /home/zapotek/workspace/rkn/application/components/reporters/html.rb

 [*] json:
--------------------
Name:           JSON
Description:
Exports the audit results as a JSON (.json) file.

Options:
 [~]    outfile - Where to save the report.
 [~]    Type:        string
 [~]    Default:     2026-06-04_11_40_13_+0300.json
 [~]    Required?:   false

Author:         Tasos "Zapotek" Laskos <[email protected]>
Version:        0.1.3
Path:   /home/zapotek/workspace/rkn/application/components/reporters/json.rb

 [*] markdown:
--------------------
Name:           Markdown
Description:
Exports the audit results as a Markdown (.md) file.

Options:
 [~]    outfile - Where to save the report.
 [~]    Type:        string
 [~]    Default:     2026-06-04_11_40_13_+0300.md
 [~]    Required?:   false

 [~]    ai_friendly - Emit a flatter, compacter Markdown variant tuned for LLM ingestion (no TOC, blobs truncated, explicit section markers).
 [~]    Type:        bool
 [~]    Default:     false
 [~]    Required?:   false

Author:         Tasos "Zapotek" Laskos <[email protected]>
Version:        0.1
Path:   /home/zapotek/workspace/rkn/application/components/reporters/markdown.rb

 [*] marshal:
--------------------
Name:           Marshal
Description:
Exports the audit results as a Marshal (.marshal) file.

Options:
 [~]    outfile - Where to save the report.
 [~]    Type:        string
 [~]    Default:     2026-06-04_11_40_13_+0300.marshal
 [~]    Required?:   false

Author:         Tasos "Zapotek" Laskos <[email protected]>
Version:        0.1.1
Path:   /home/zapotek/workspace/rkn/application/components/reporters/marshal.rb

 [*] pdf:
--------------------
Name:           PDF
Description:
Exports the audit results as a PDF (.pdf) file.

Options:
 [~]    outfile - Where to save the report.
 [~]    Type:        string
 [~]    Default:     2026-06-04_11_40_13_+0300.pdf
 [~]    Required?:   false

Author:         Tasos "Zapotek" Laskos <[email protected]>
Version:        0.5
Path:   /home/zapotek/workspace/rkn/application/components/reporters/pdf.rb

 [*] stdout:
--------------------
Name:           Stdout
Description:
Prints the results to standard output.

Author:         Tasos "Zapotek" Laskos <[email protected]>
Version:        0.3.3
Path:   /home/zapotek/workspace/rkn/application/components/reporters/stdout.rb

 [*] txt:
--------------------
Name:           Text
Description:
Exports the audit results as a text (.txt) file.

Options:
 [~]    outfile - Where to save the report.
 [~]    Type:        string
 [~]    Default:     2026-06-04_11_40_13_+0300.txt
 [~]    Required?:   false

Author:         Tasos "Zapotek" Laskos <[email protected]>
Version:        0.2.1
Path:   /home/zapotek/workspace/rkn/application/components/reporters/txt.rb

 [*] xml:
--------------------
Name:           XML
Description:
Exports the sink-trace entries as an XML (.xml) file.

Options:
 [~]    outfile - Where to save the report.
 [~]    Type:        string
 [~]    Default:     2026-06-04_11_40_13_+0300.xml
 [~]    Required?:   false

Author:         Tasos "Zapotek" Laskos <[email protected]>
Version:        0.5.0
Path:   /home/zapotek/workspace/rkn/application/components/reporters/xml.rb

 [*] yaml:
--------------------
Name:           YAML
Description:
Exports the audit results as a YAML (.yaml) file.

Options:
 [~]    outfile - Where to save the report.
 [~]    Type:        string
 [~]    Default:     2026-06-04_11_40_13_+0300.yaml
 [~]    Required?:   false

Author:         Tasos "Zapotek" Laskos <[email protected]>
Version:        0.2
Path:   /home/zapotek/workspace/rkn/application/components/reporters/yaml.rb
Copyright
Copyright 2024 Ecsypno.
All rights reserved.