Web UI
The WebUI allows you to easily run, manage and schedule scans and their results via an intuitive web interface.
Table of contents
Boot-up
To boot the Pro interface please run:
bin/spectre_pro
After boot-up, you can visit the interface via your browser of choice.
Features
Scan management
- Quick scan. A one-input form in the navbar will scan any URL with sane defaults — useful for ad-hoc spot checks without leaving the current page.
- Parallel scans. Run multiple scans concurrently against the same site, different sites, or both — bounded only by configured worker capacity.
- Recurring scans. Re-scan the same target on a schedule and get an
automatic review of every finding compared to the previous revision:
- Fixed — issues that no longer appear.
- Regressions — fixed issues that re-appeared.
- New — first-time findings.
- Trusted / untrusted / reviewed / false-positive — manual states for triage that carry forward across revisions.
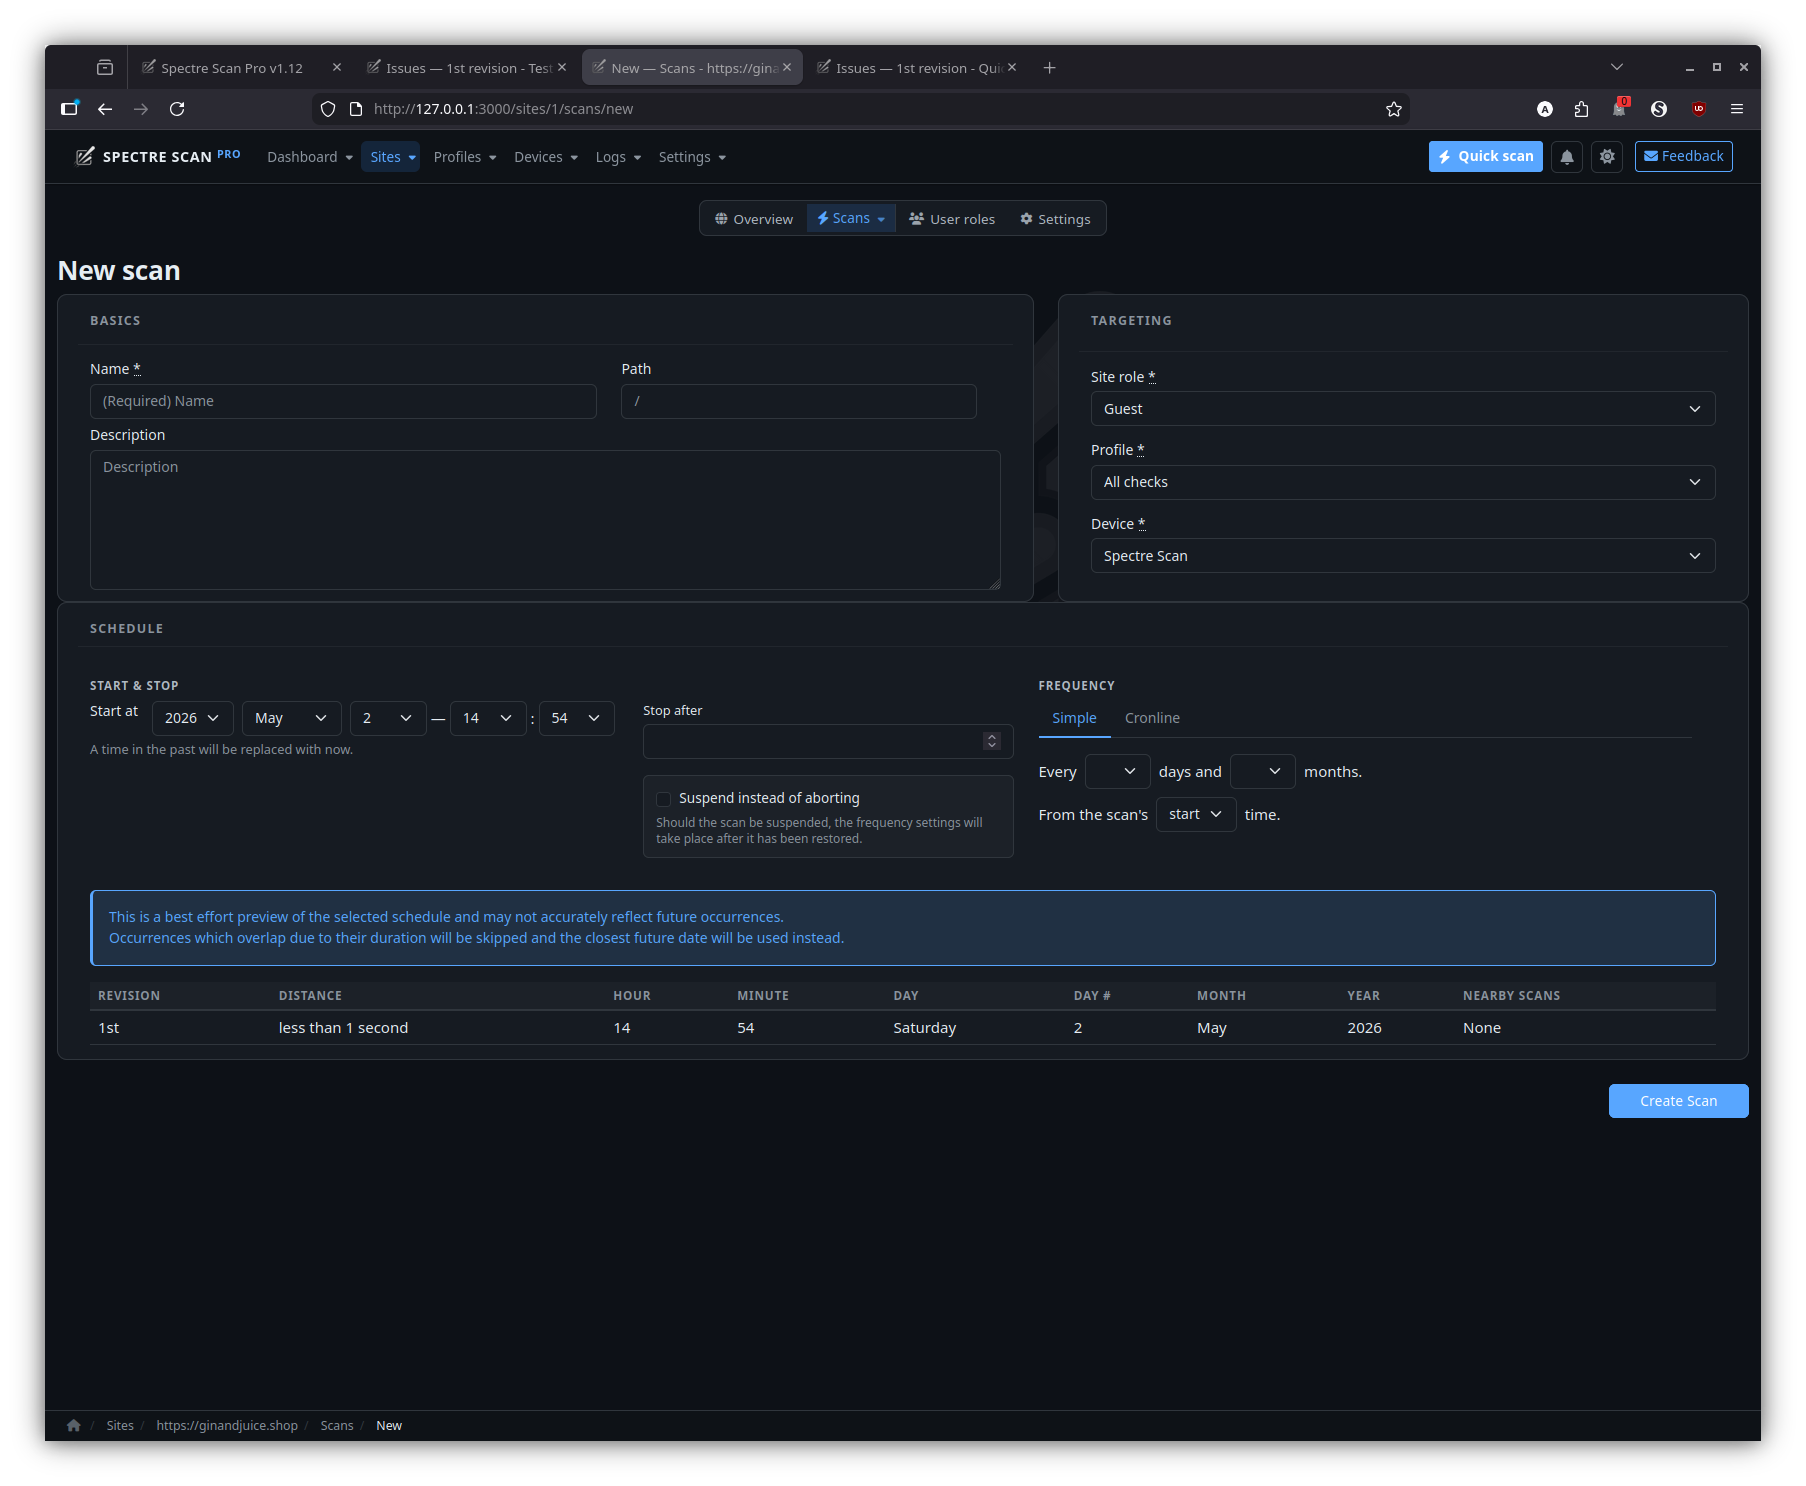
- Scheduled scans. Either pick from preset frequencies (hourly, daily, weekly…) or paste a cron expression. The scheduler surfaces upcoming occurrences and flags conflicts (overlapping start times, parallelism ceiling) before they fire.
- Suspend / resume / repeat. Pause a long-running scan and resume from the same on-disk session later. One-click repeat re-runs a finished scan with the exact same configuration.
Live monitoring
- Real-time progress. Coverage, request rate, discovered pages and newly-found issues stream into the UI over Action Cable as the scan runs — no manual refresh.
- Live event-driven cache busts. Per-user dashboard / navbar caches invalidate the moment a model commits, so counts and badges stay truthful without polling.
- Scan, revision and site live views. Drill in at the level you need: whole-site activity, a specific scan or a single revision.
Findings & analysis
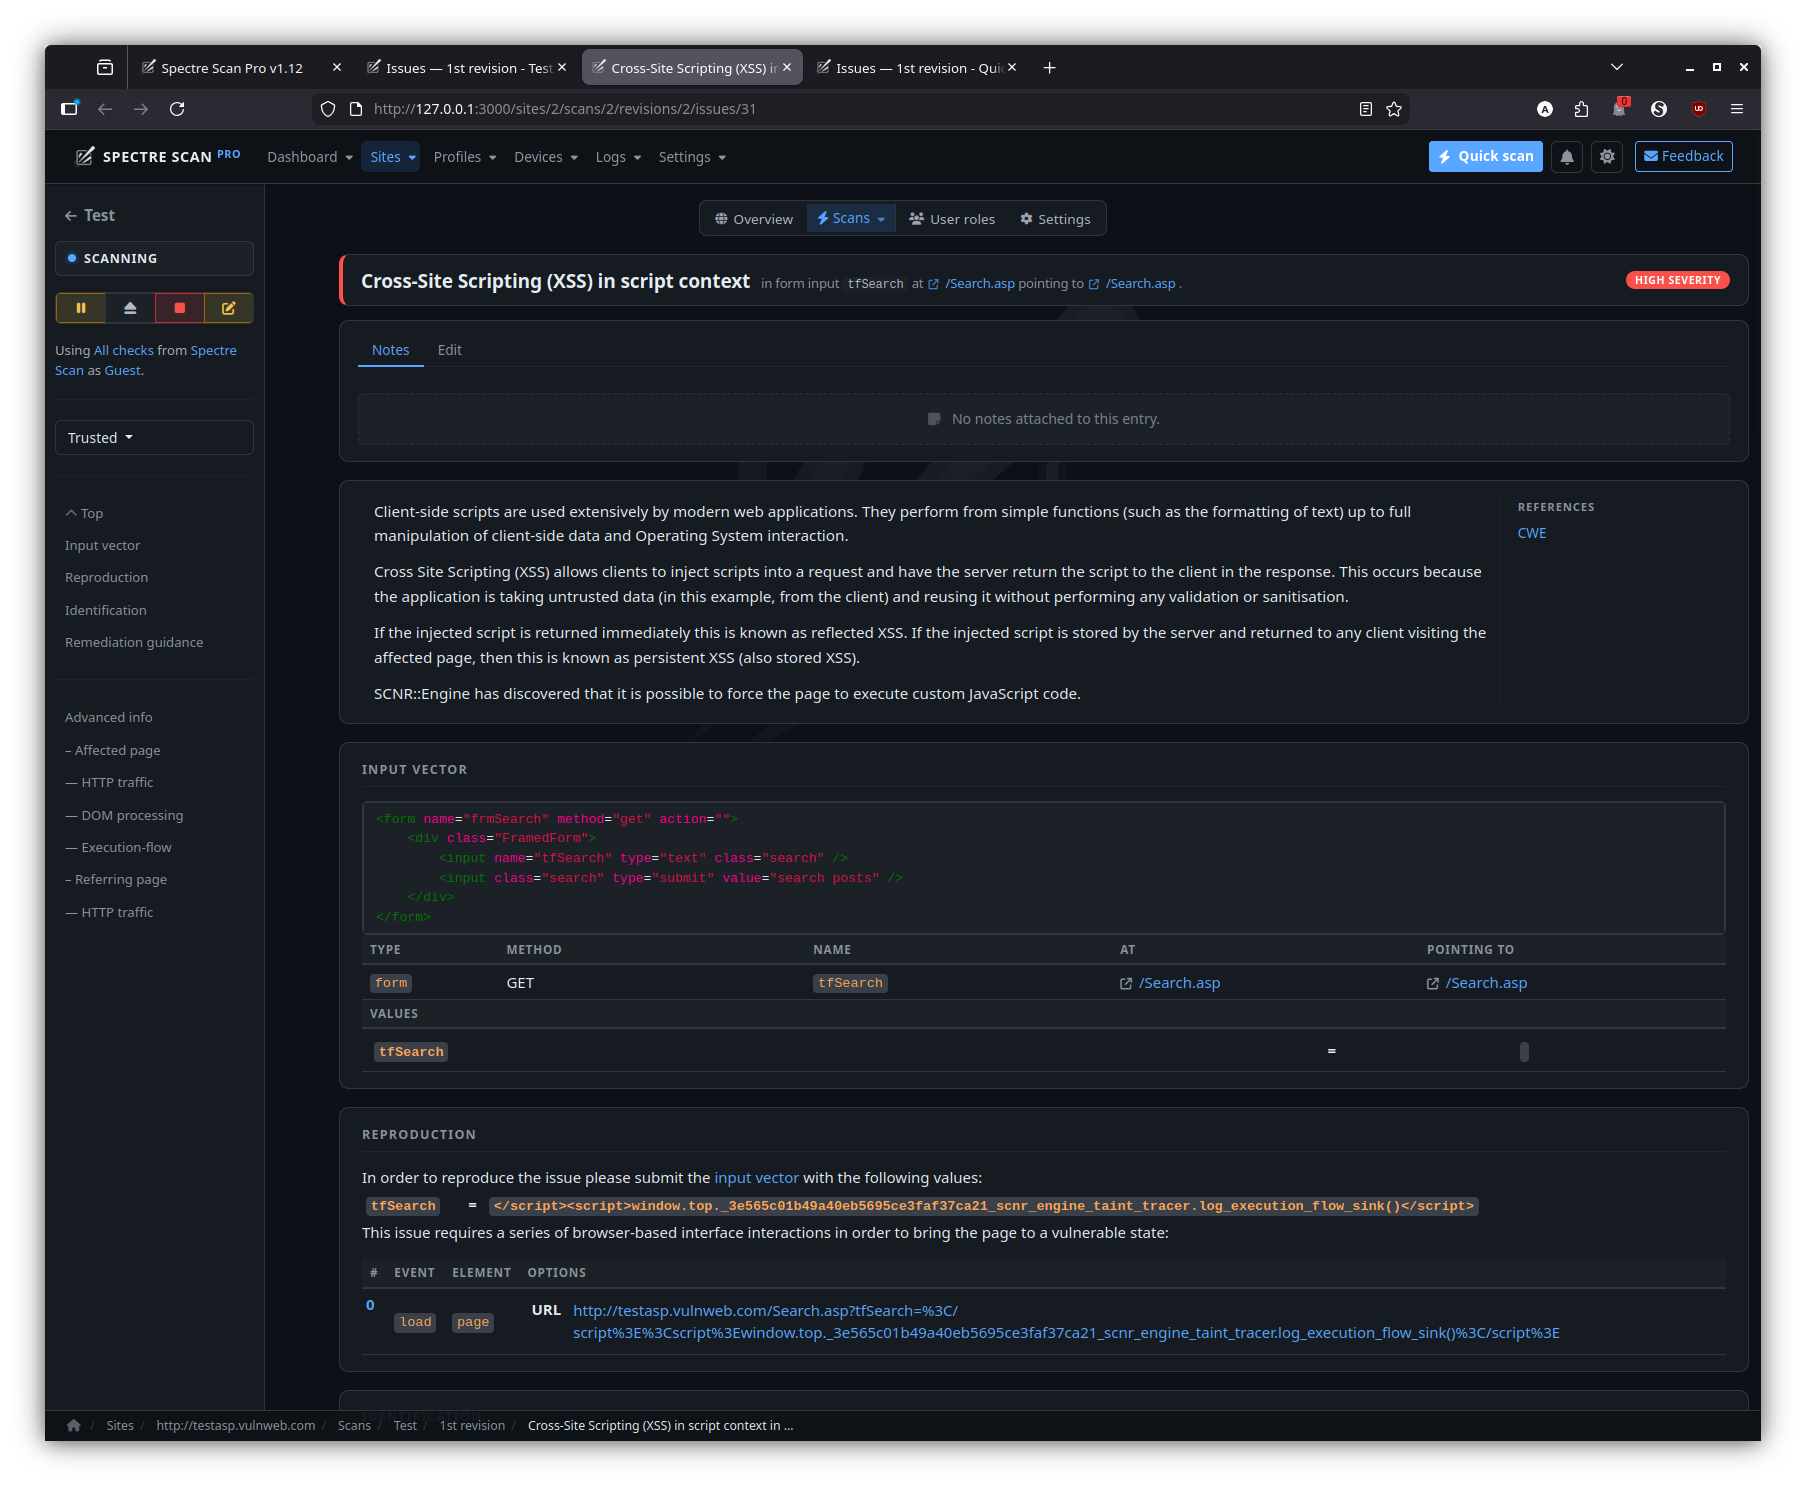
- Issue detail with proof, remediation and exploit. Every finding is presented with the captured request / response, normalised proof, a per-check remediation guide and (when available) a working exploit payload.
- DOM-XSS introspector. For DOM-level findings, follow the data flow from source to sink across the rendered page with captured stack frames and the page snapshot inline.
- Coverage explorer. Every page the scanner reached, with HTTP status, content-type and a one-click jump to the issues attached to it.
- Powerful filtering. Stack severity / state / type / scan / revision filters; narrow by site, by check, by URL pattern; permalinks survive reload and live-refresh.
- Severity-aware sorting. High-impact findings always float to the top, with sibling-grouping so duplicate signatures collapse cleanly.
Configuration
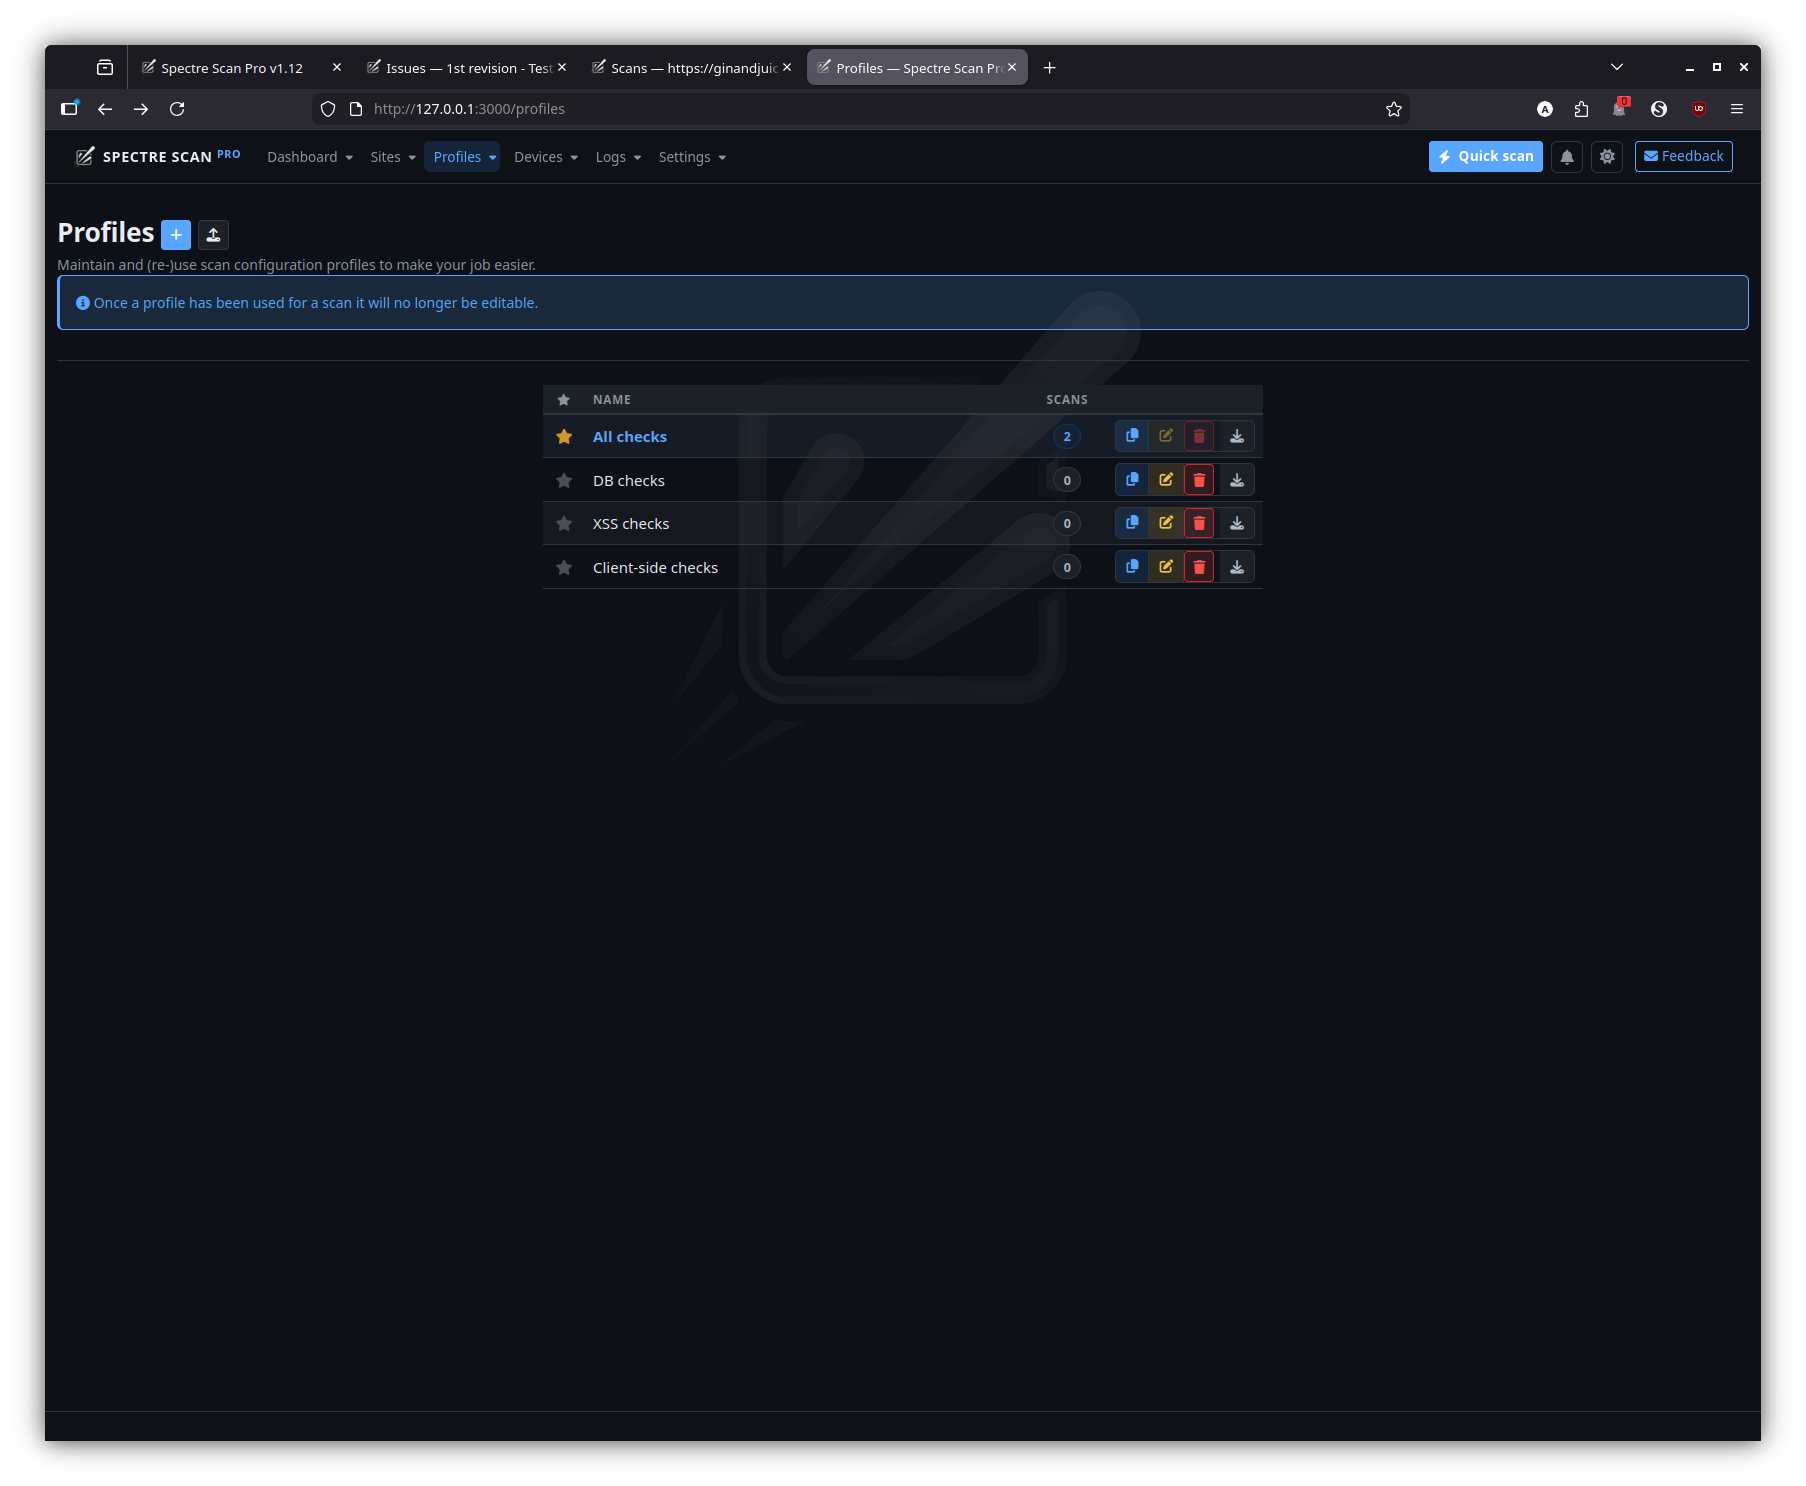
- Scan profiles. Reusable bundles of checks, scope rules, audit options and plug-ins. Per-user, per-site or shared.
- Per-site overrides. Override profile scope rules at the site level without forking a whole profile.
- Device emulation. Scan as a desktop browser, mobile, tablet, or any custom user-agent / viewport / touch combination.
- Site user roles. Authenticate the scanner as one or more
application personas:
- Form login — declarative URL + form parameters.
- Script login — drop in Ruby with a prepared browser driver (Watir) or HTTP client.
- Each role gets its own captured session that persists across revisions.
Operations & audit
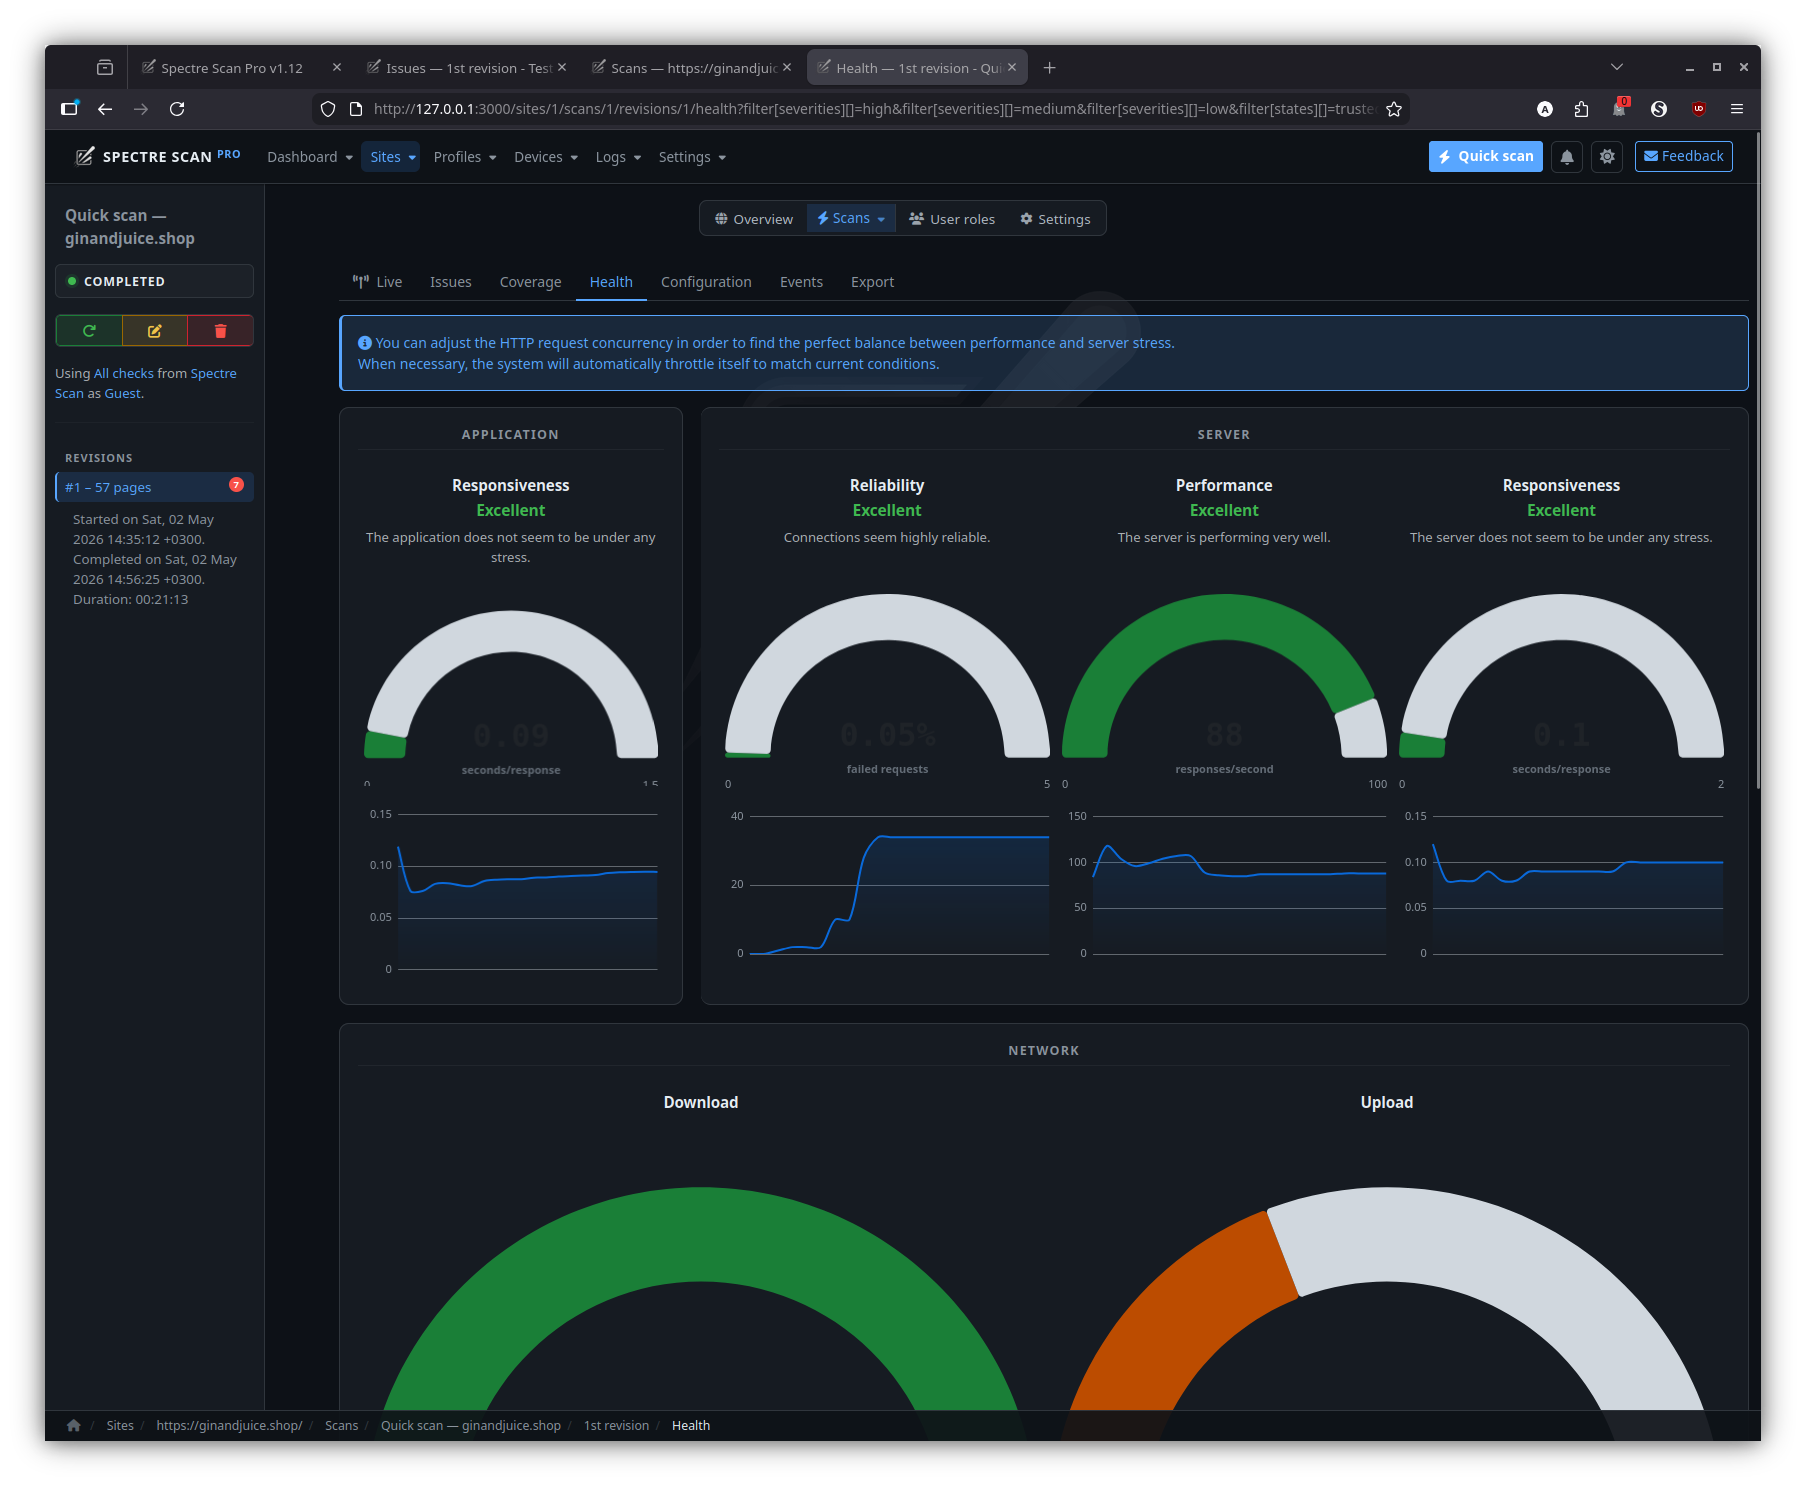
- Server / scanner / network health. Request rate, response times, browser-pool utilisation, error counts, queue depth — surfaced in charts that update live.
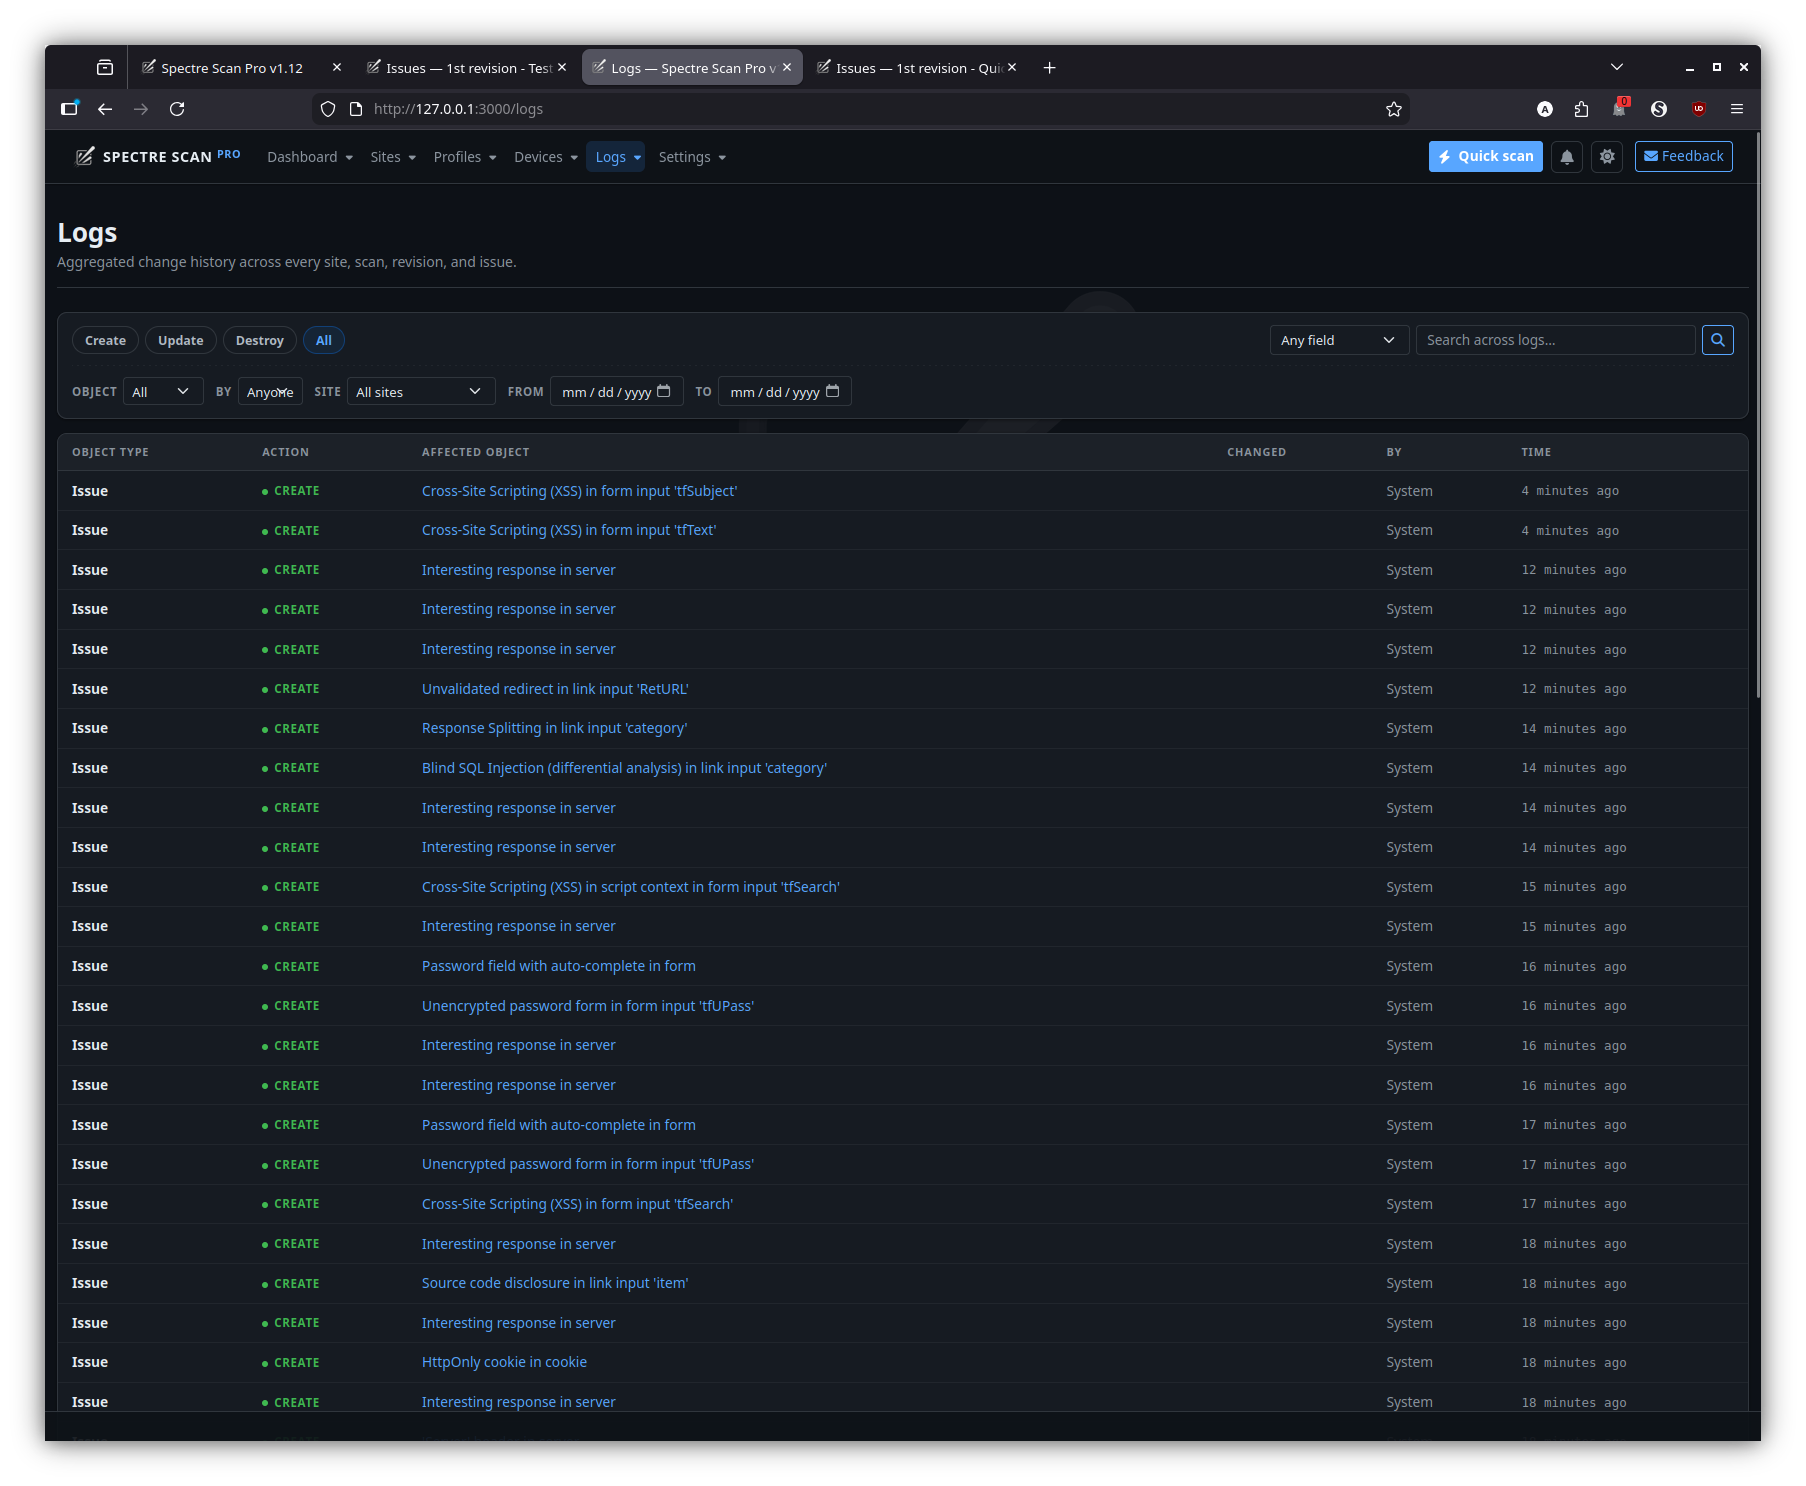
- Full audit log. Every change to sites, scans, revisions, issues and user roles is captured (PaperTrail) with the actor, the diff and a click-through to the affected object — even after the object itself has been deleted.
- Resilient scheduler. SQLite writer-lock contention, autoloader races and transient RPC errors are handled internally; the UI stays responsive while two or more scans hammer the database.
Reporting & integrations
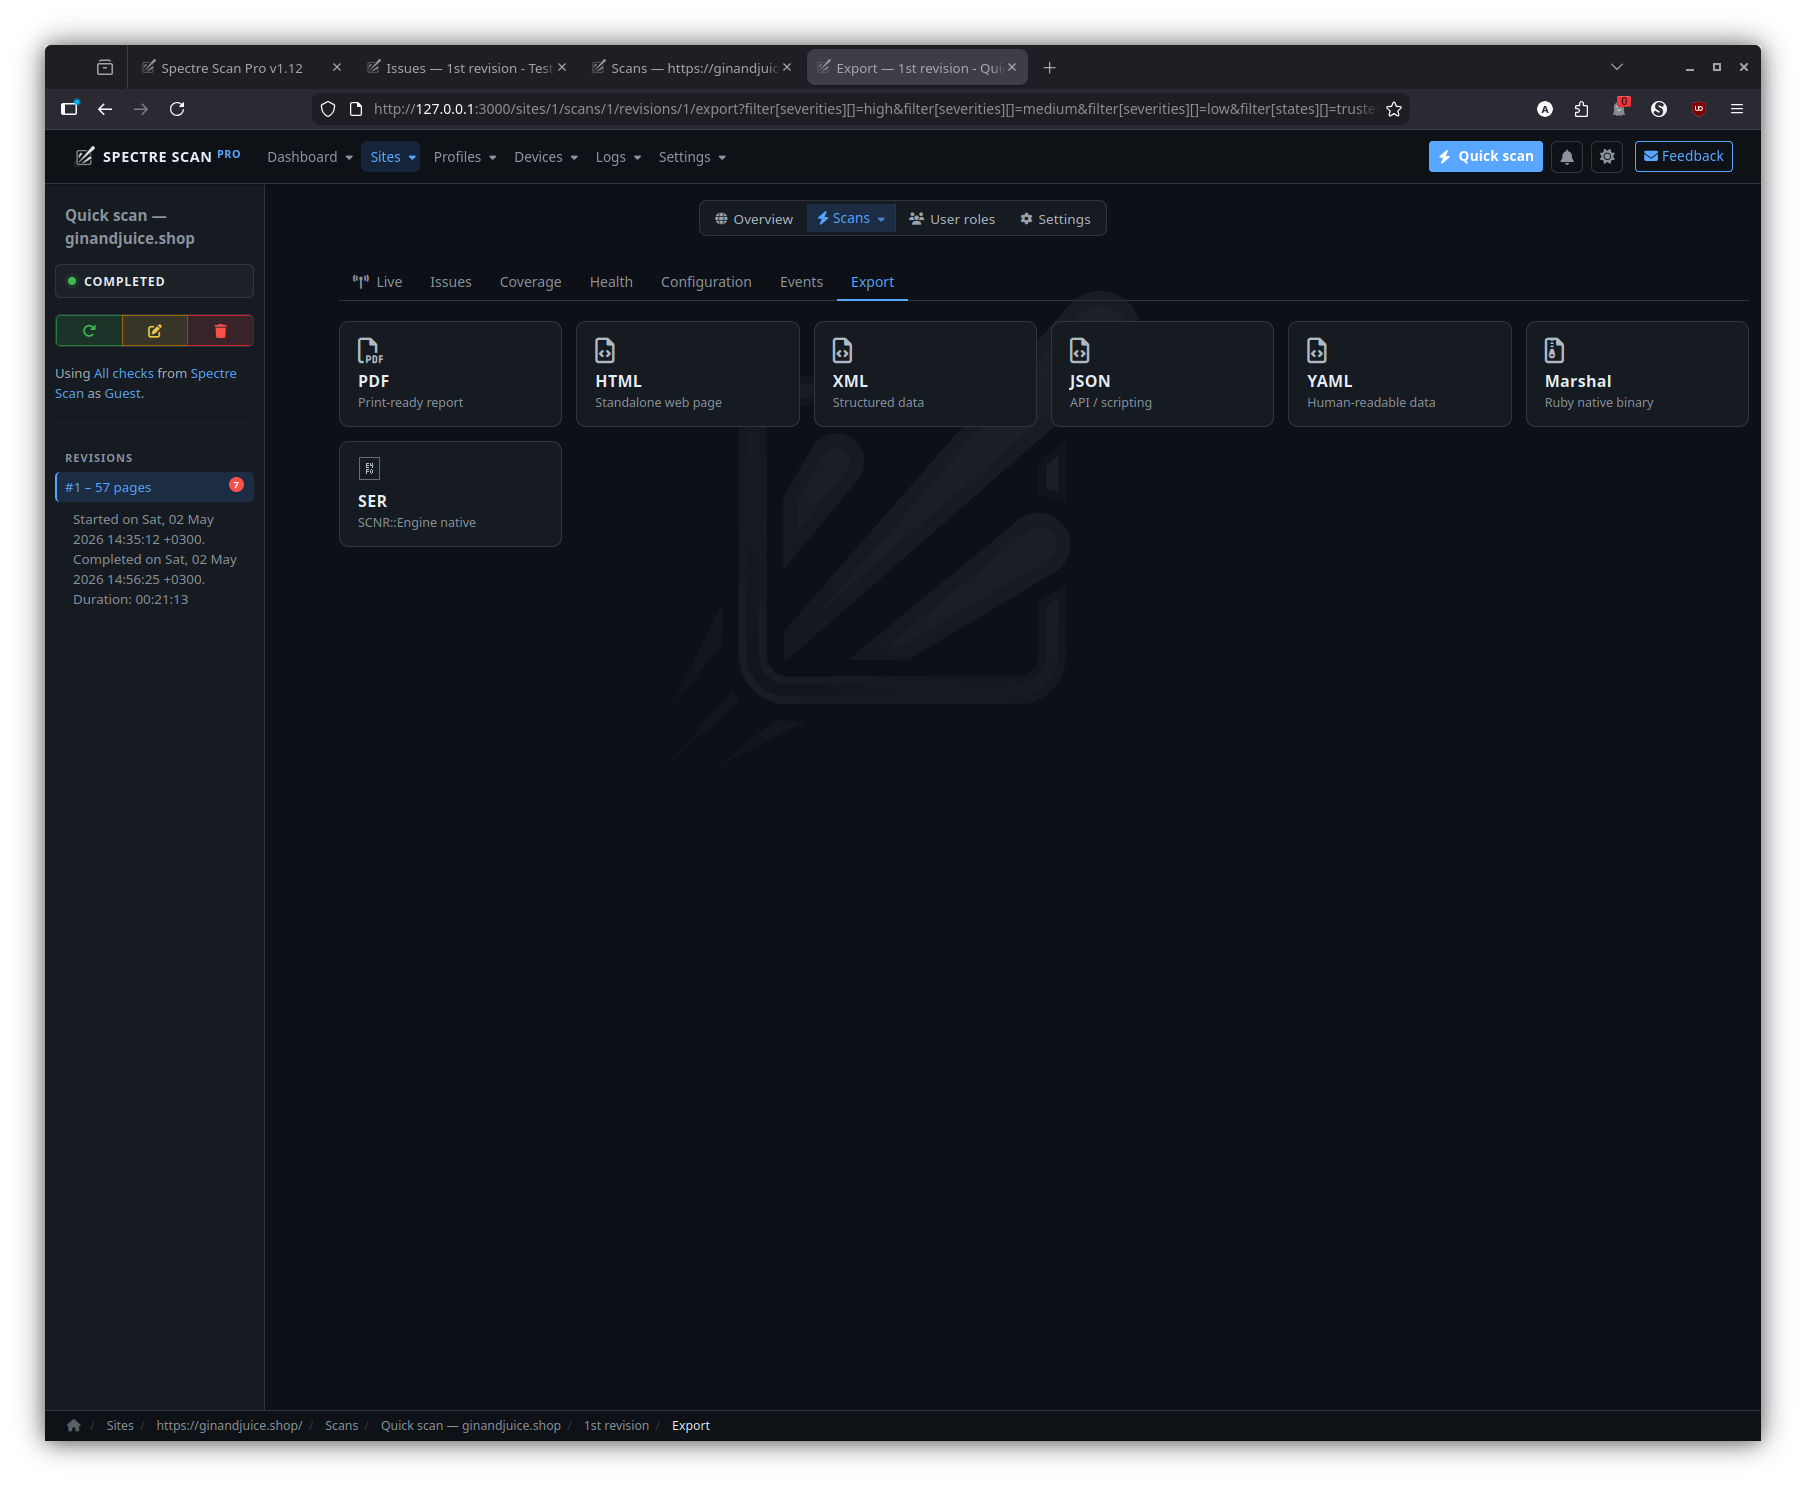
- Multi-format export. HTML, JSON, XML, plain-text and the application-native SER archive — at the scan, revision or filtered result-set level.
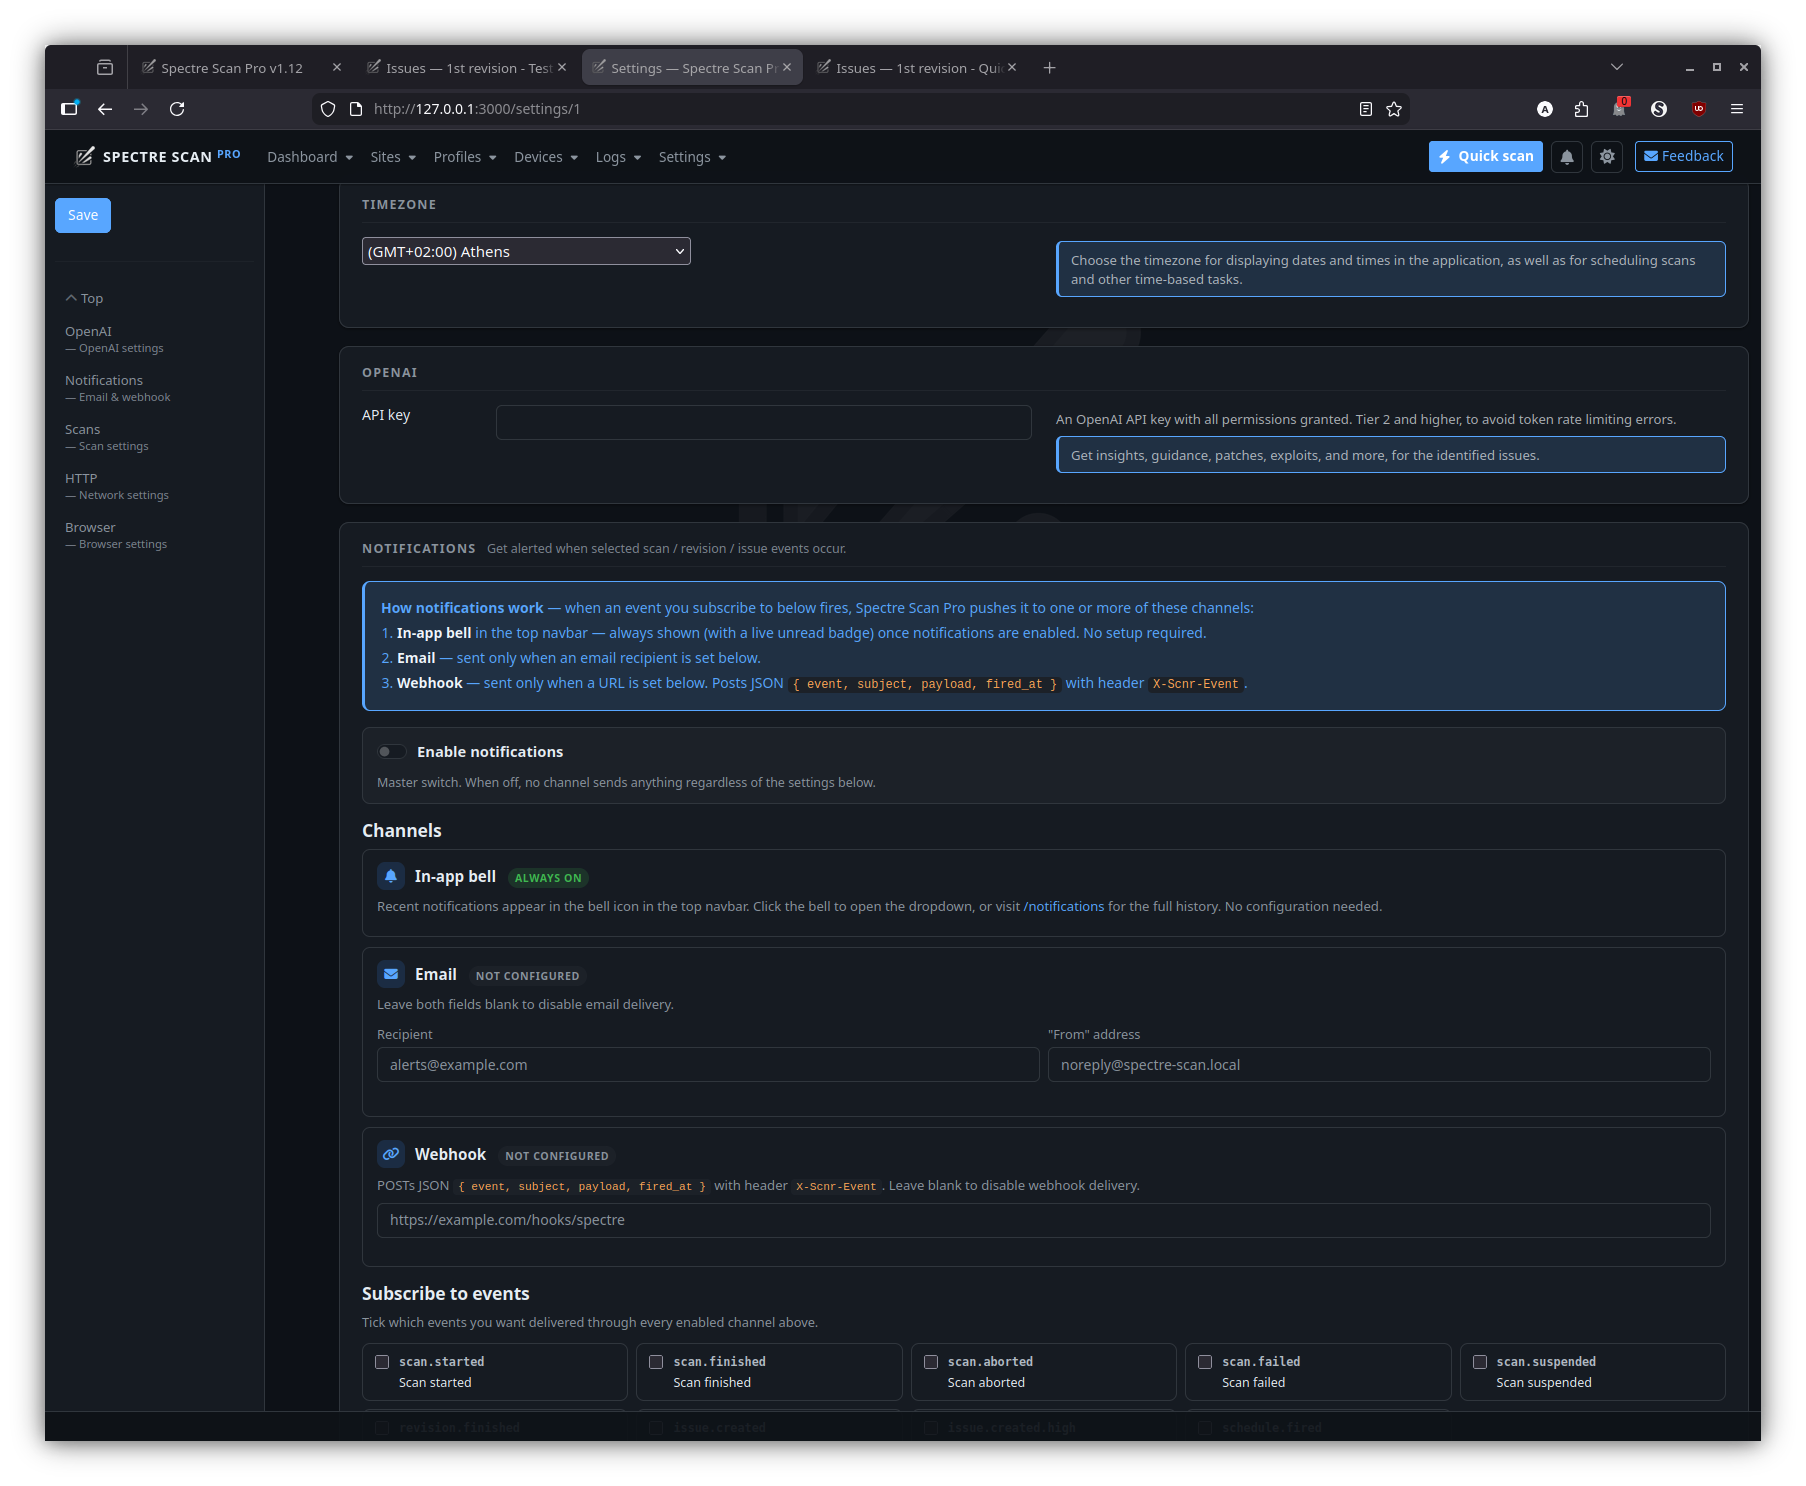
- Notifications. Per-event email / browser push for scan start / finish / failure / suspension and severity thresholds.
- OpenAI assist. Optional LLM-backed remediation expansion for individual findings (configurable in Settings).
Djin! — in-app AI assistant
- Side-dock chat on every page. A right-side panel (with full- page expand and a launcher button bottom-right) that uses your configured AI provider (OpenAI or Claude) — same key as the per-issue OpenAI assist. Streamed replies via Action Cable; conversation history persists per-user.
- Page-aware grounding. Each turn carries the current
(controller, action, resource ids)so questions like “what’s this issue?” or “how bad is this revision?” are answered against what you’re looking at, no need to spell it out. - Read tools. Djin! can call
list_sites/list_scans/list_revisions/list_issues, drill into a single record (fetch_issue,fetch_revision), free-textsearchacross sites / scans / issues, and return your accessible scope. Every query is scoped to the records you own — Djin! cannot see another operator’s data. - Navigation. “Take me there” works — Djin! can call
navigate_to({ kind: 'issue', id: <digest> })and your browser jumps to the issue page (or site / scan / revision). - Approval-gated write actions. Djin! can also propose
mark_false_positive,mark_fixed,clear_state,pause_scan/resume_scan/abort_scan, andstart_scan. Every write tool surfaces an inline yellow card in the dock with the proposed args — nothing happens until you click Approve. Deny instead and Djin! sees the rejection reason and adjusts. - Audit trail. Approved Djin!-driven mutations are tagged with
whodunnit = "djin:<your_id>"in the PaperTrail log, so the per-user activity feed distinguishes AI-driven actions from hand-driven ones. - Cancel & rate-limit. Stop a streaming reply mid-flight; a per-user daily token budget caps spend across conversations.
- Privacy & opt-in. Disabled by default; flip on in Settings once your AI provider key is configured. The dock surfaces an empty “configure in Settings” hint instead of failing silently if the key isn’t set.
Quality of life
- Light & dark themes with a one-click toggle that persists across
sessions and respects
prefers-color-schemeon first visit. - Per-page UI state persistence. Severity-section open/closed, collapsed details, table sort and filter selections are remembered per browser without server round-trips.
- Keyboard-friendly forms and focus-aware live-refresh: an open
<select>or focused input is never swapped out from under you. - First-run welcome. A guided empty-state experience walks new installs from “no sites yet” to “scanning” without docs.
Screenshots
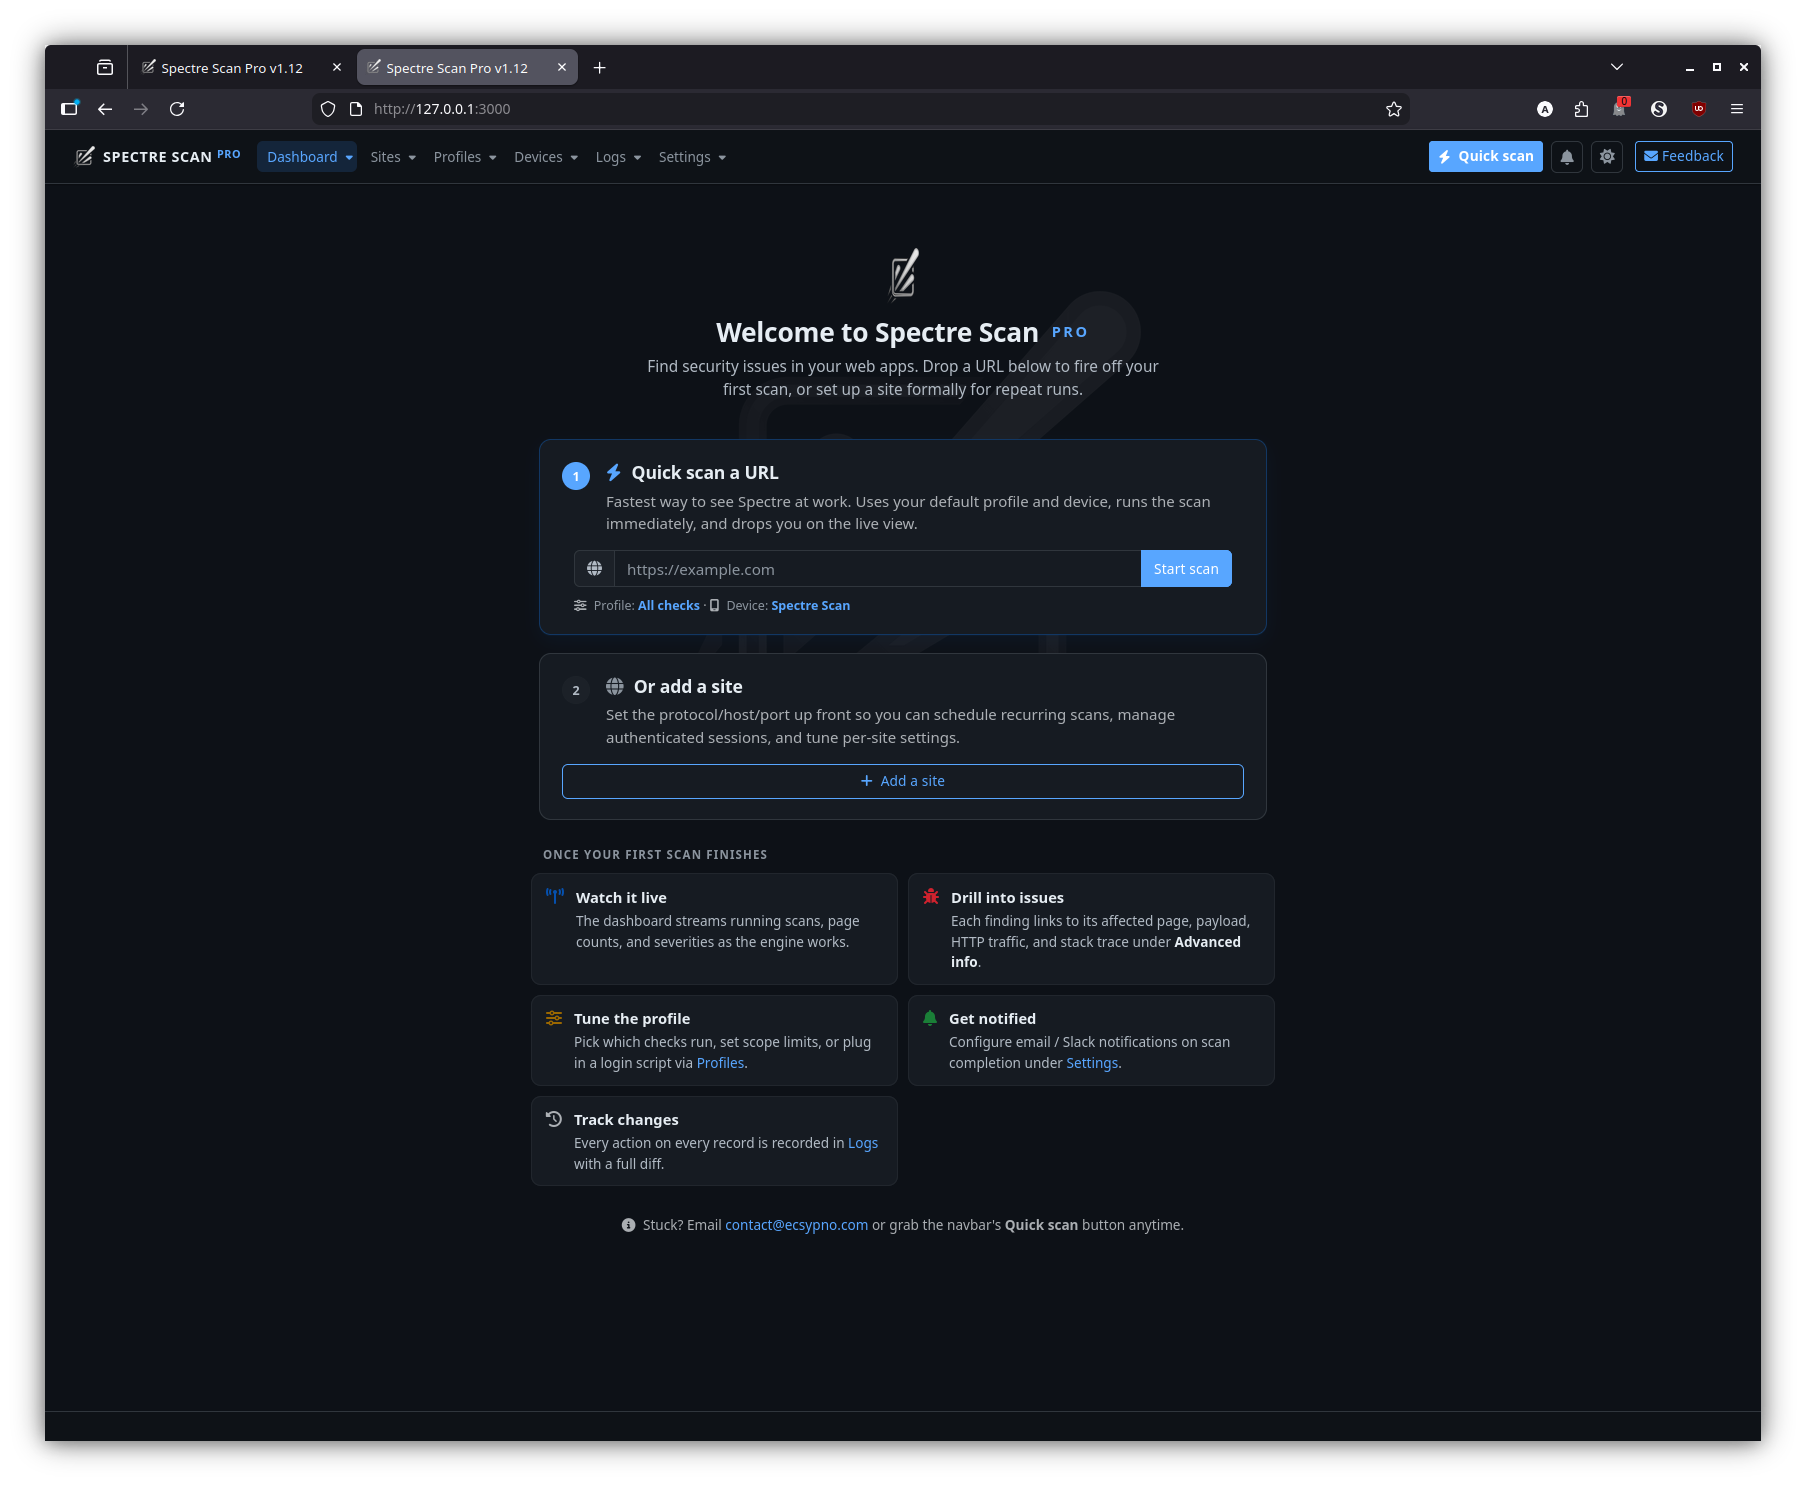
Welcome
The first-run experience: an empty-state landing page with a quick-scan form and a path to add your first site.
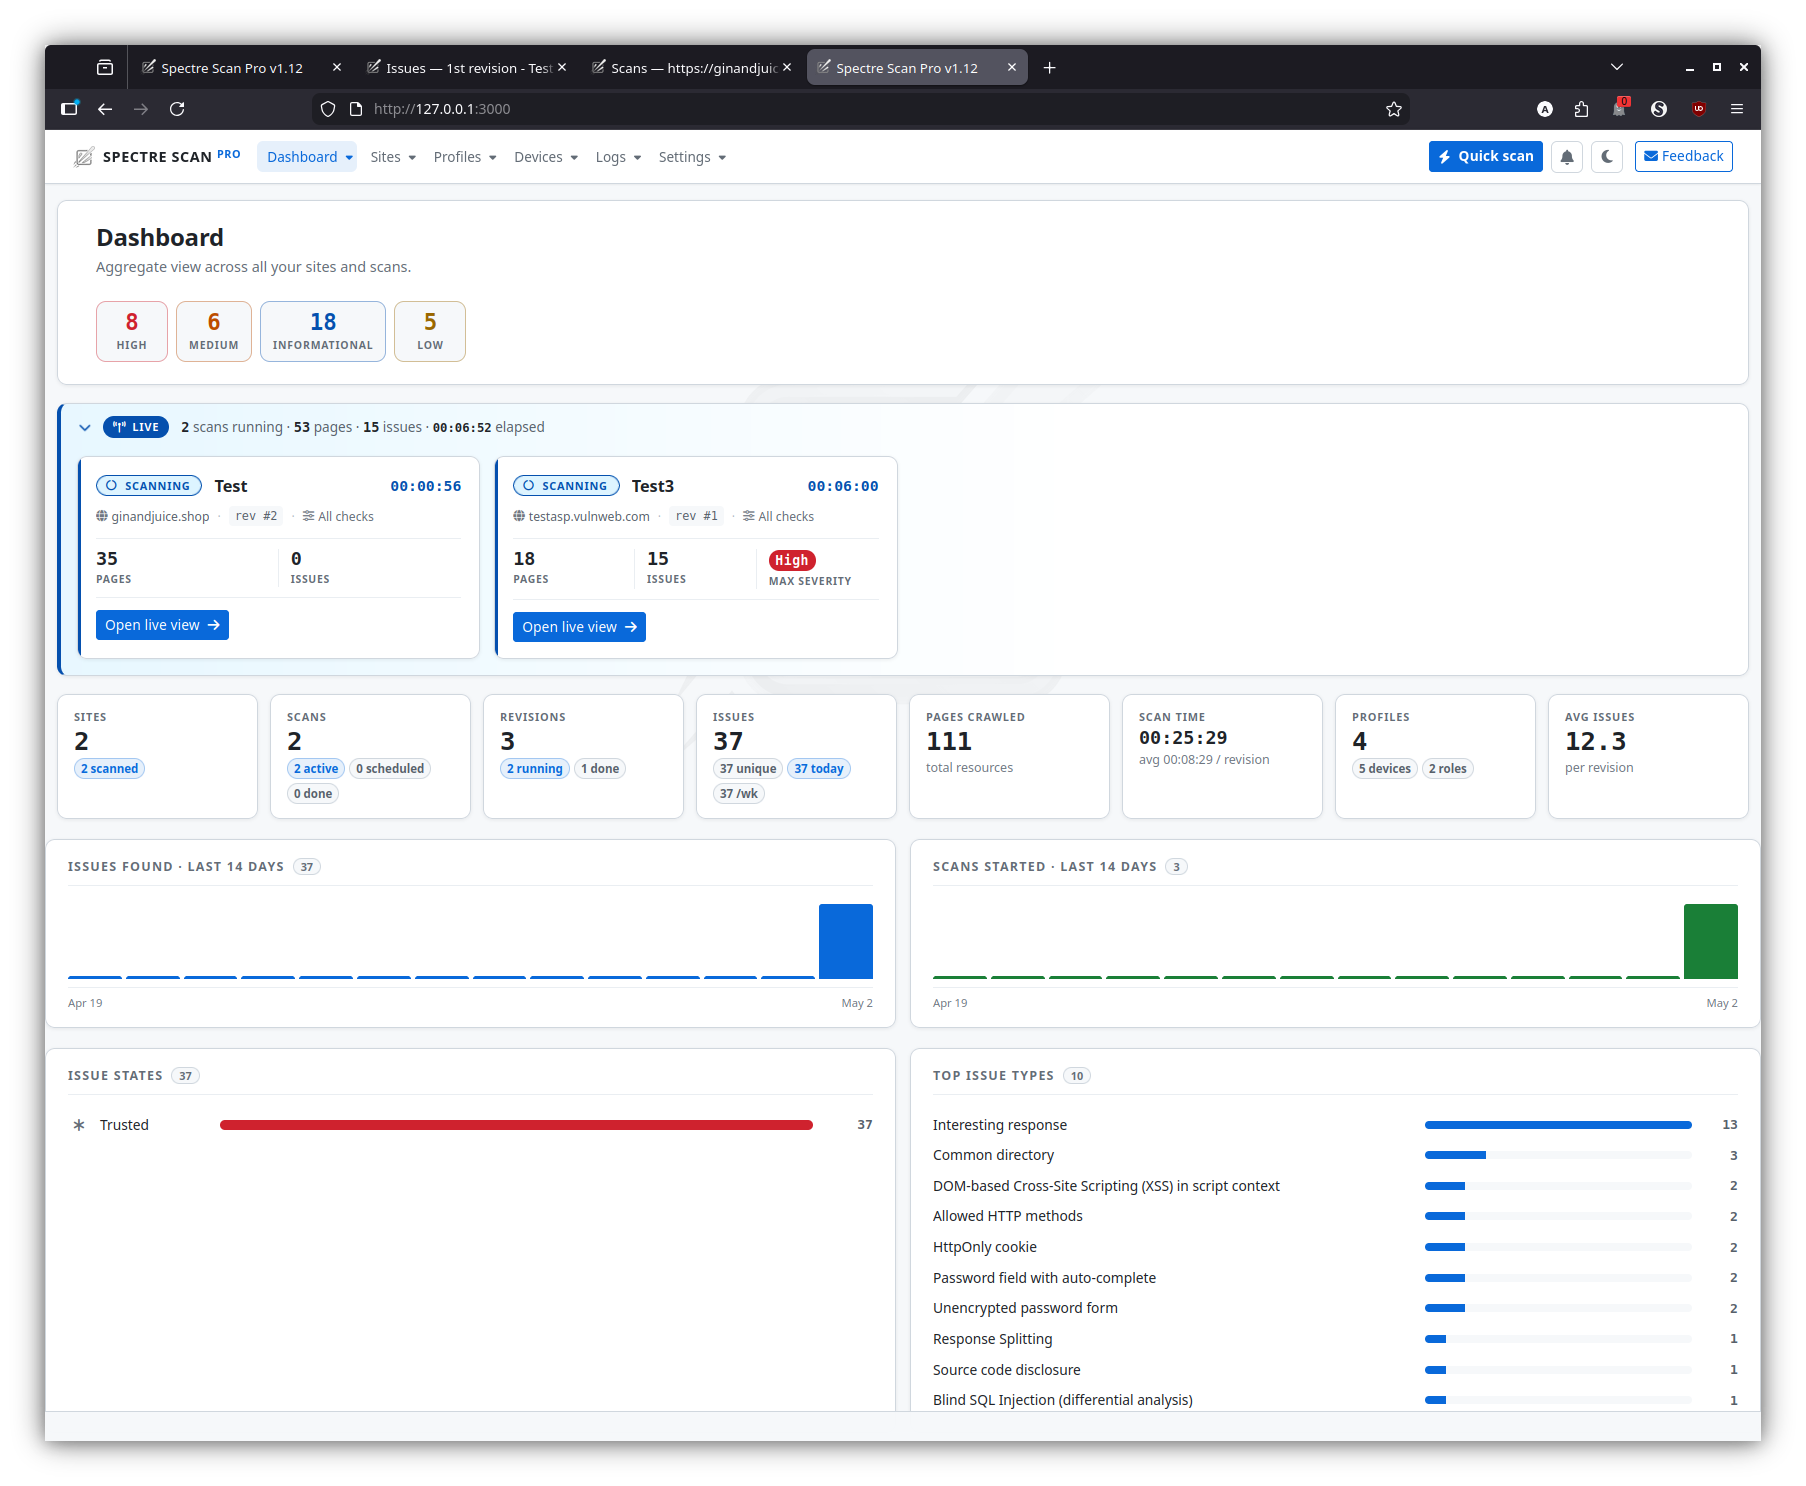
Dashboard
The dashboard is the home page once you have at least one site. It surfaces running scans, recent activity, aggregate counts and per-site health at a glance.
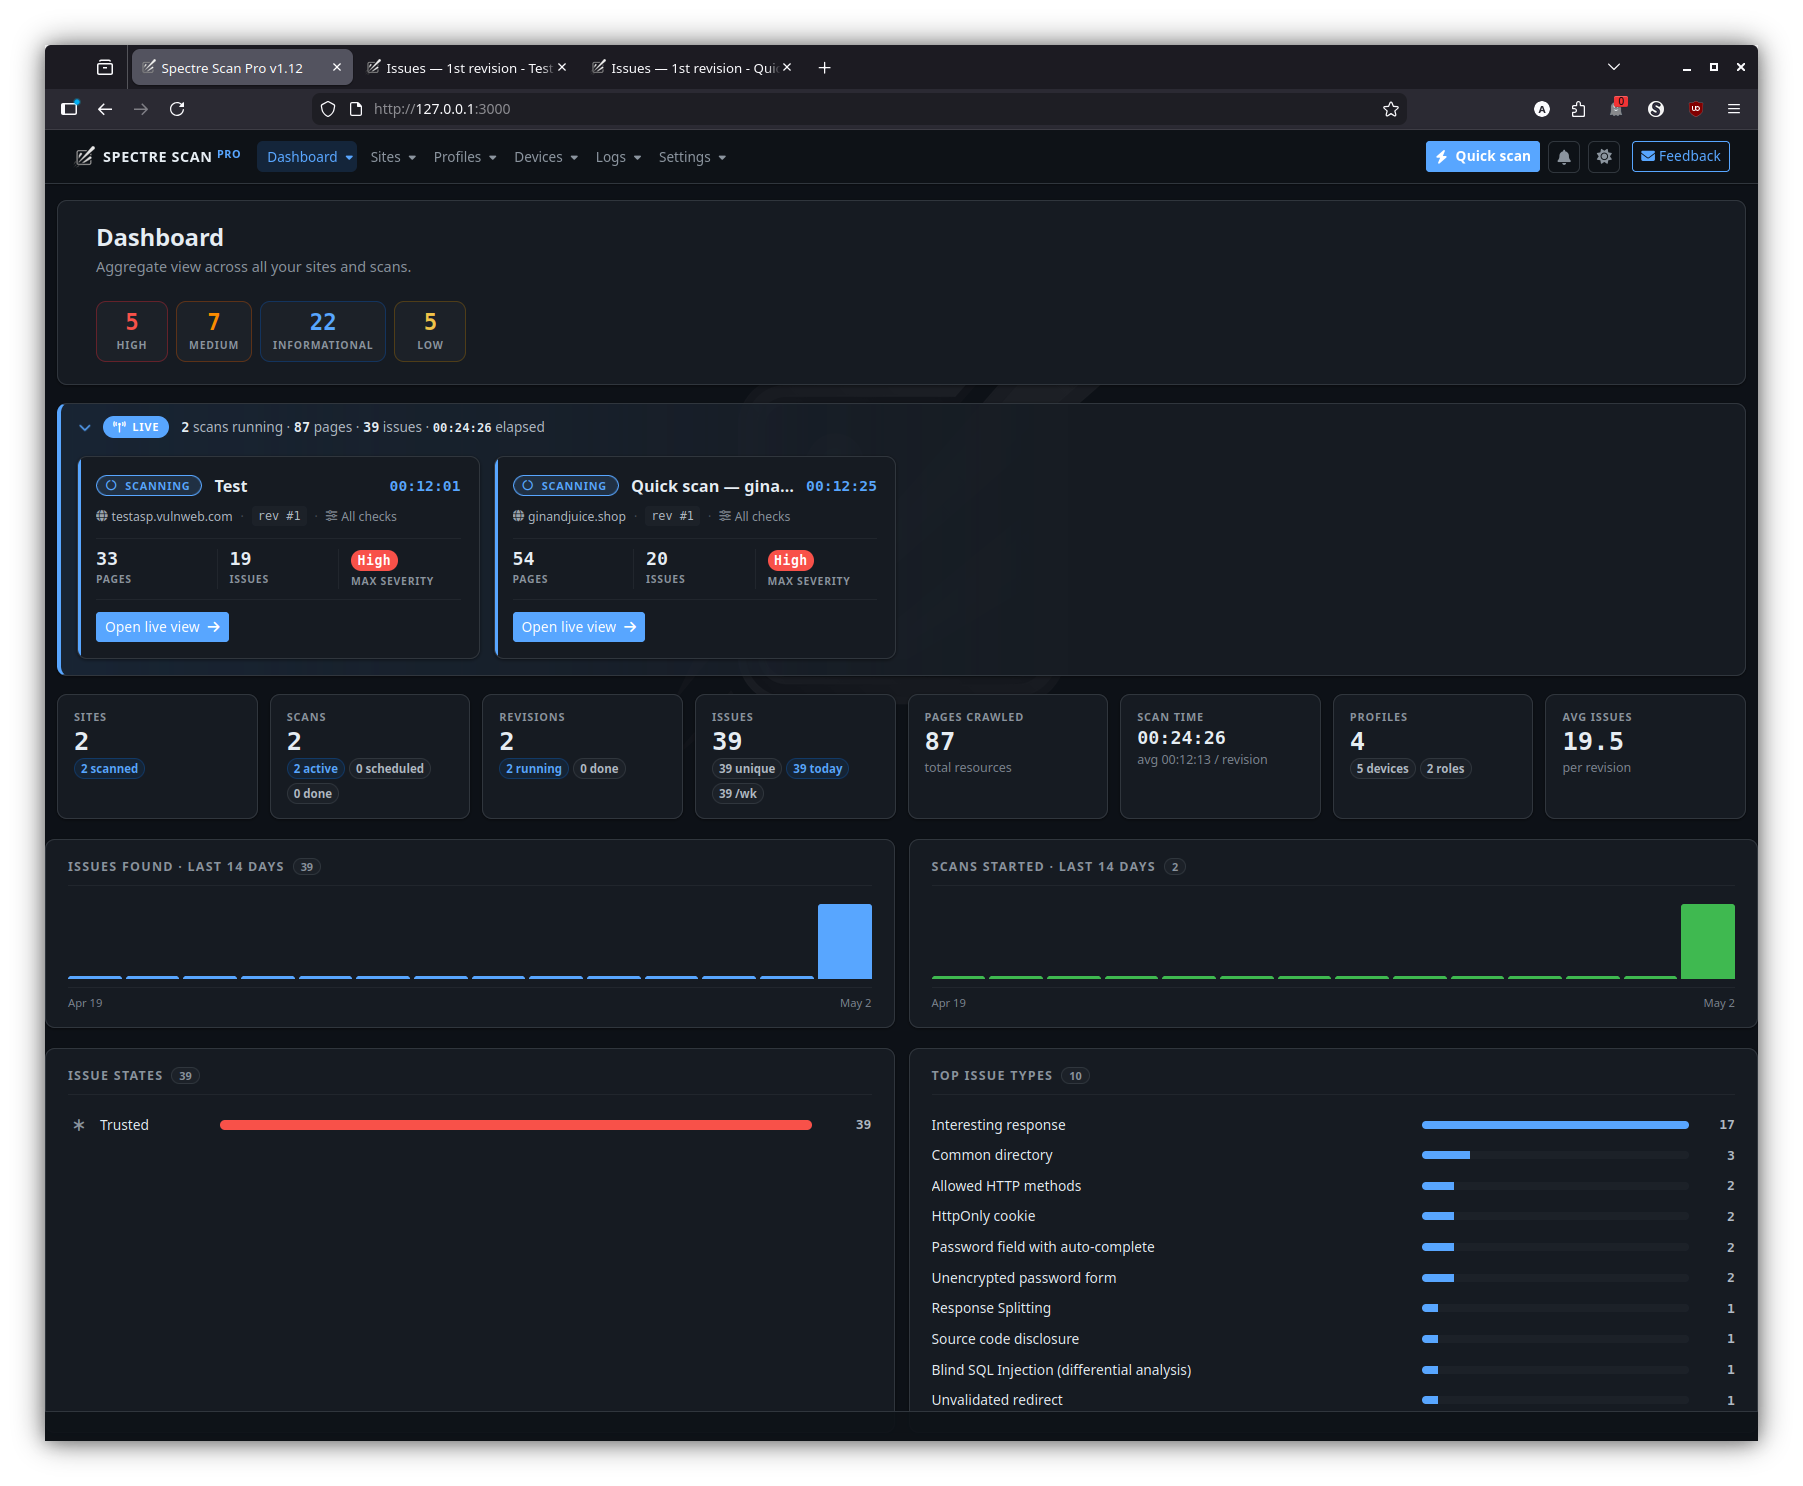
Light theme
Dark theme
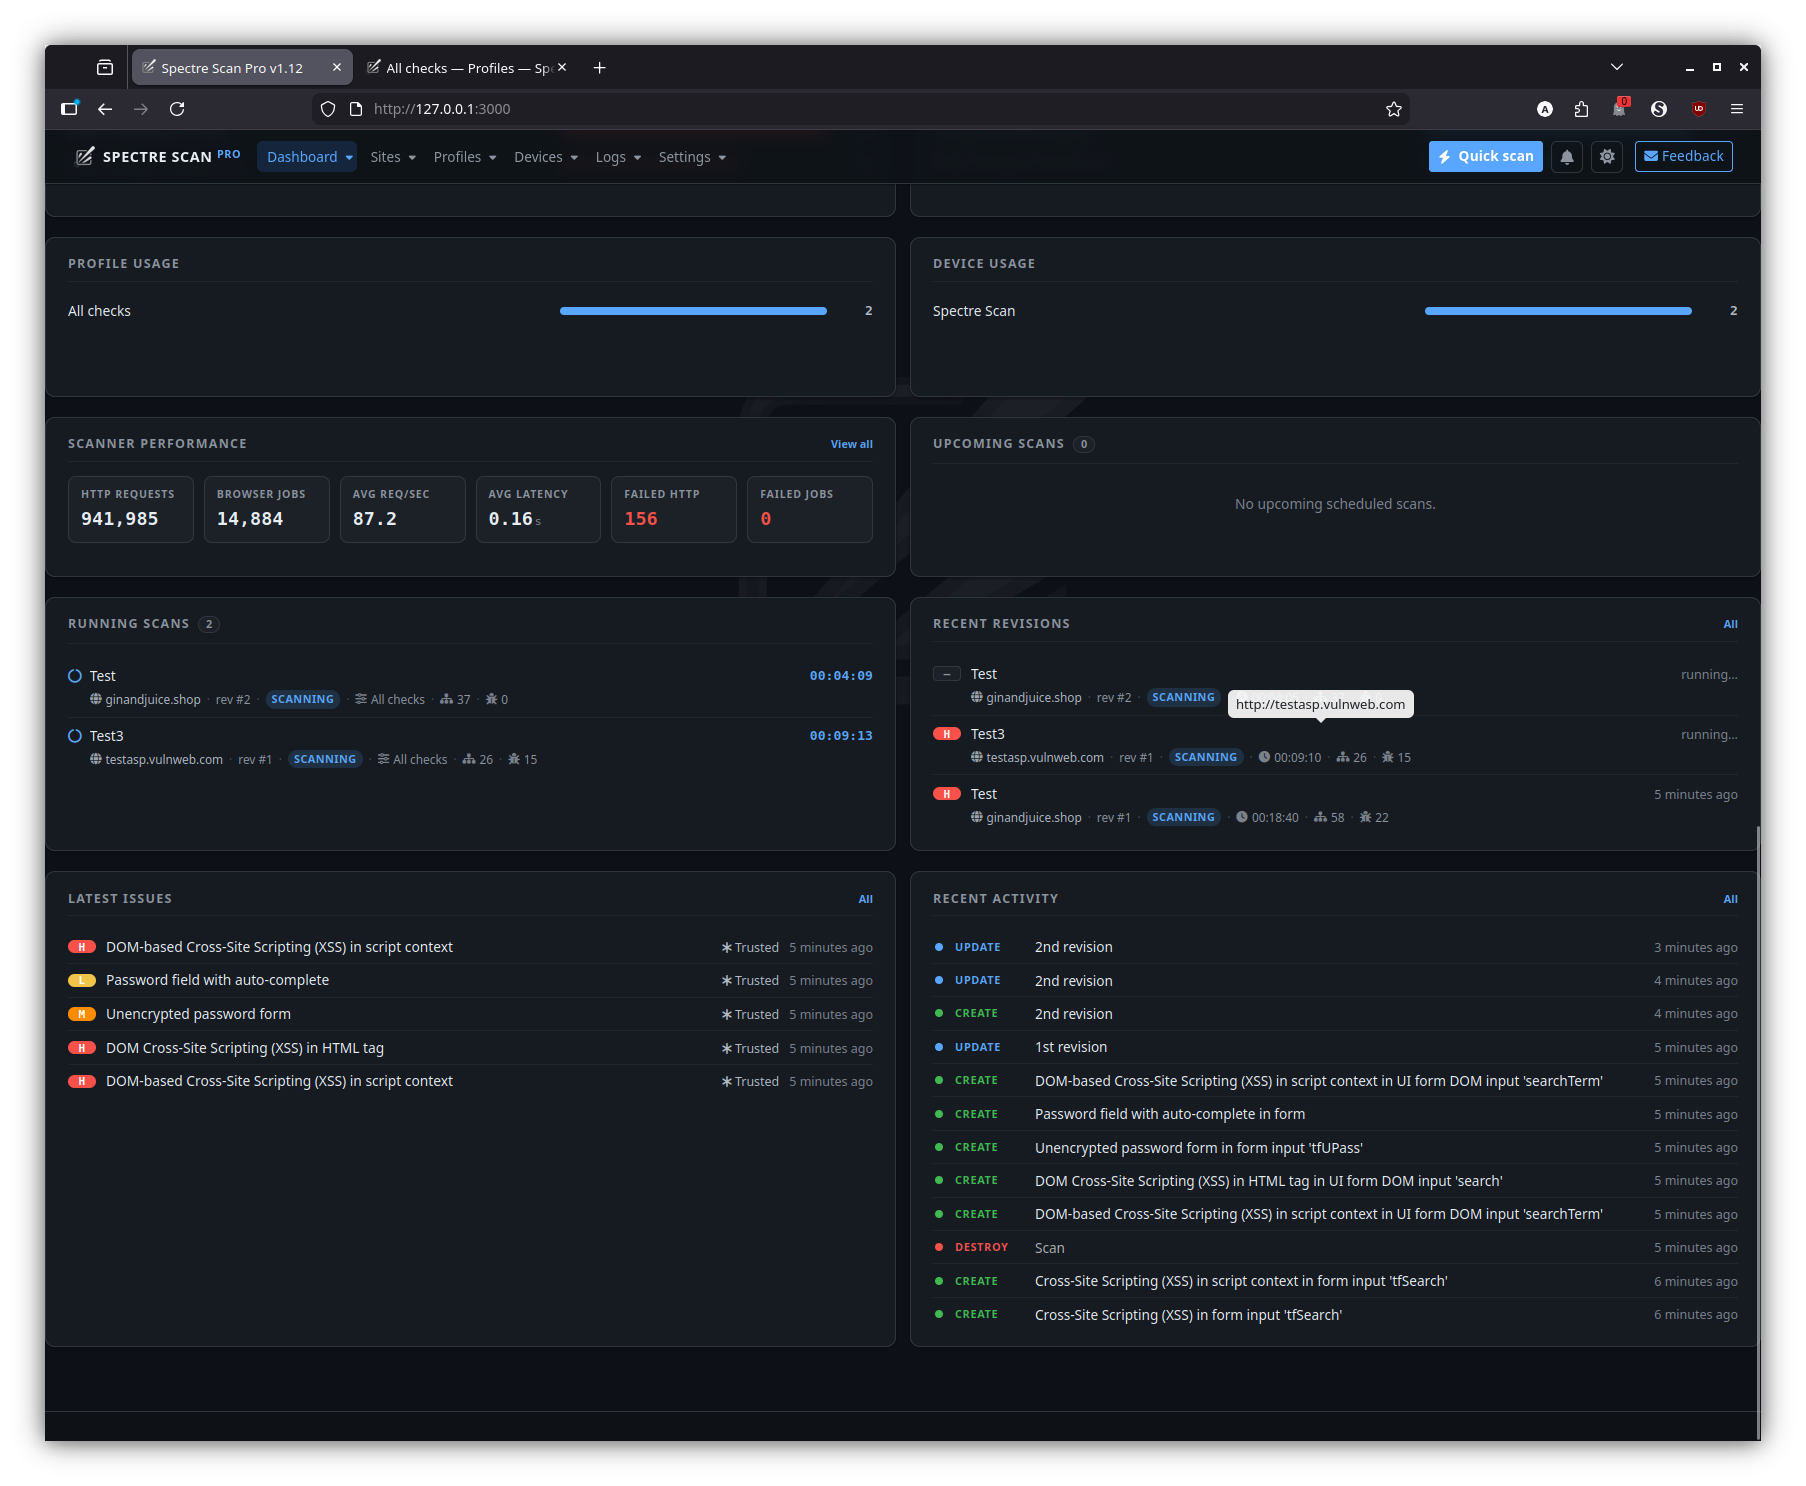
Continued view
Tiles below the fold show recent revisions, performance trends and per-site rollups.
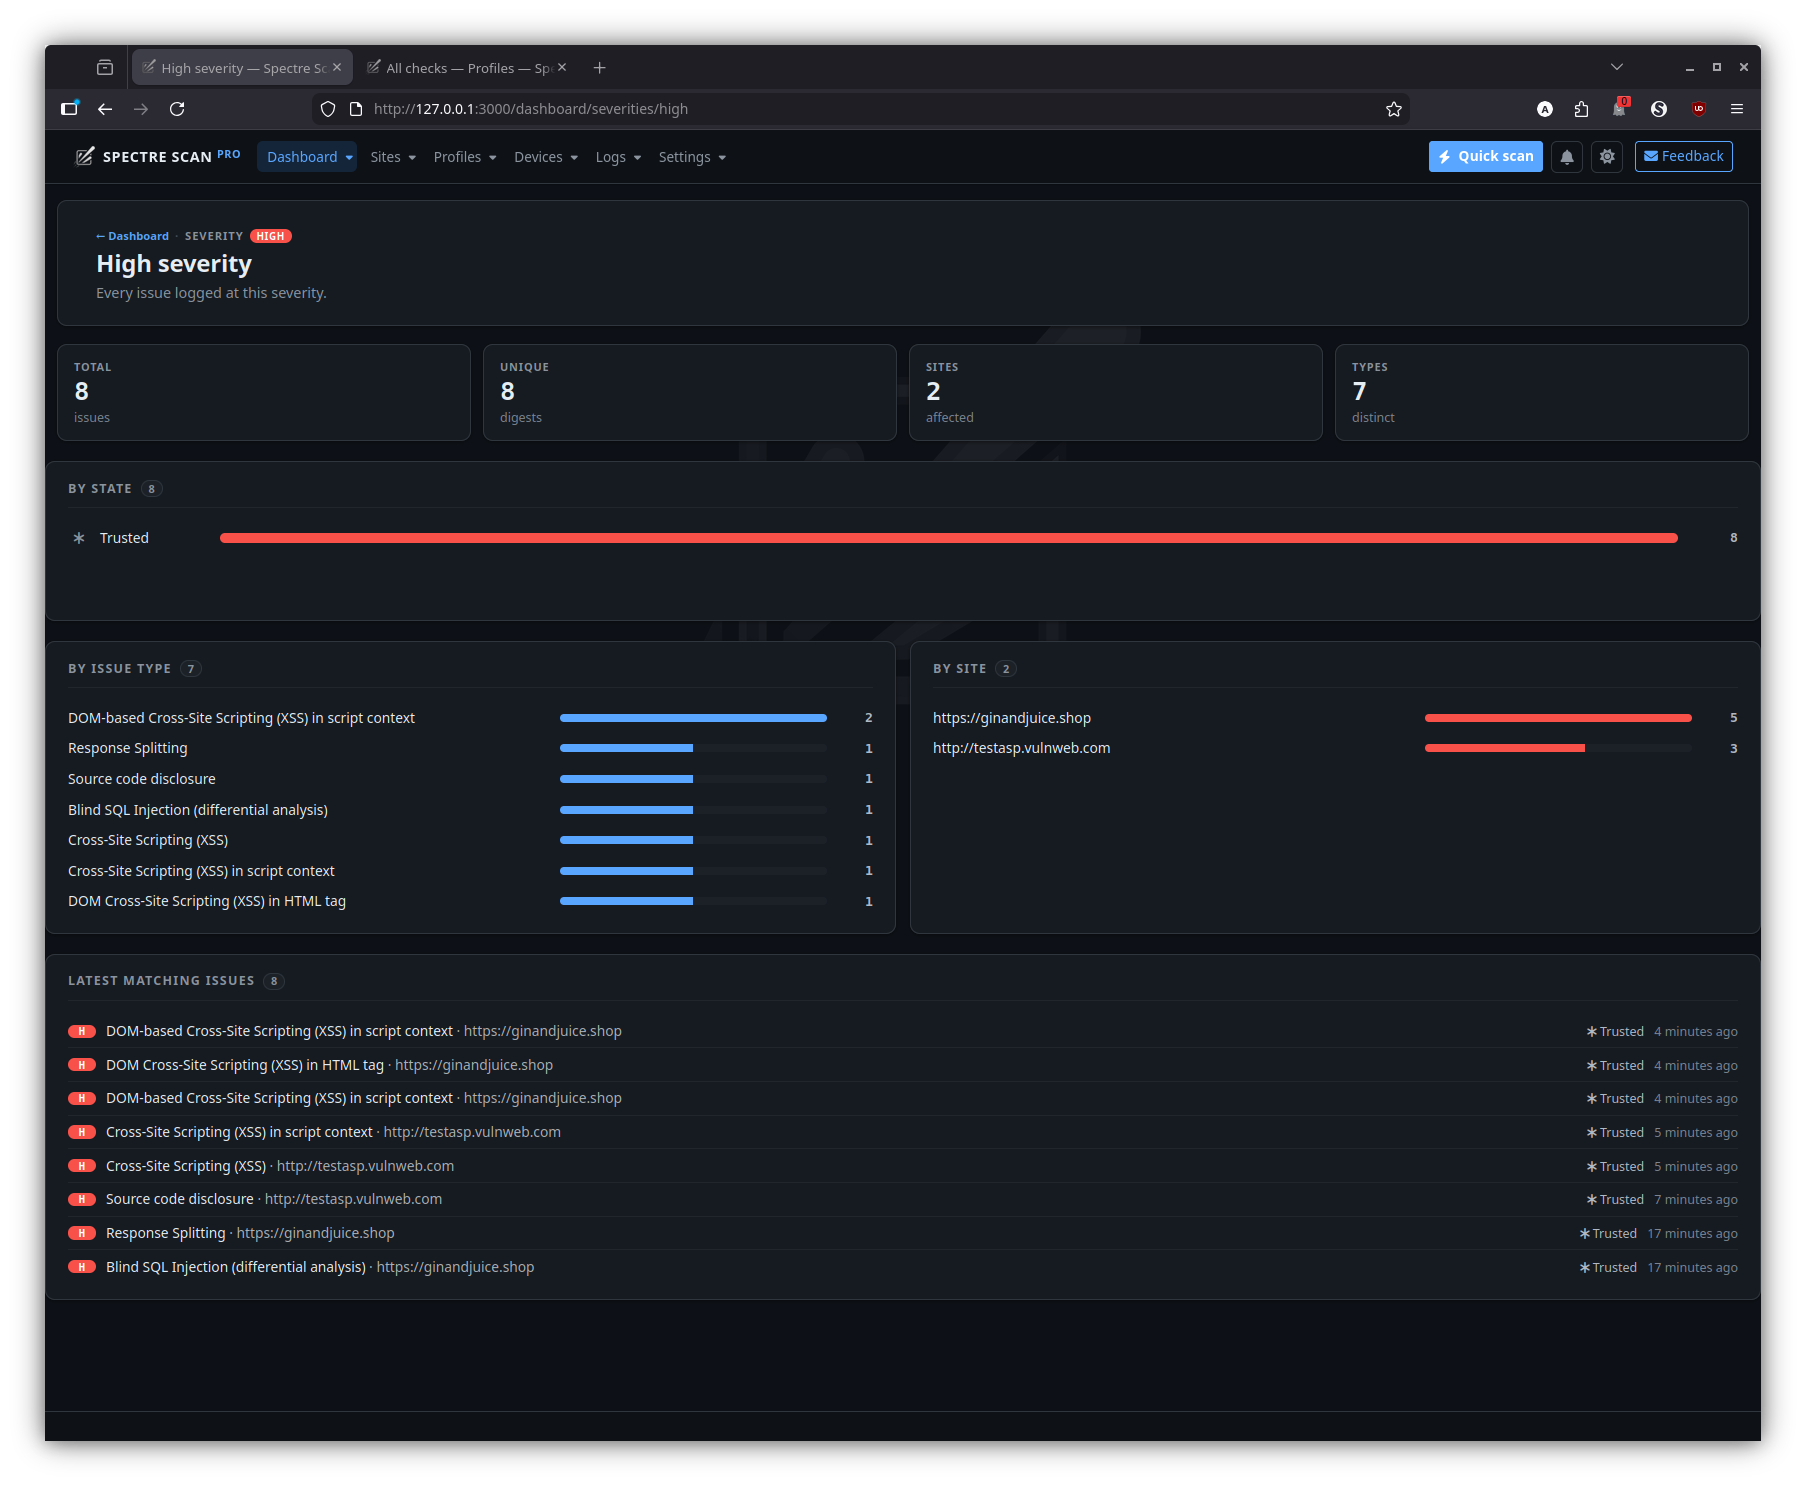
Sub-dashboard: by severity
A focused view that breaks every issue down by severity (high / medium / low / informational), with click-through to the matching issue list.
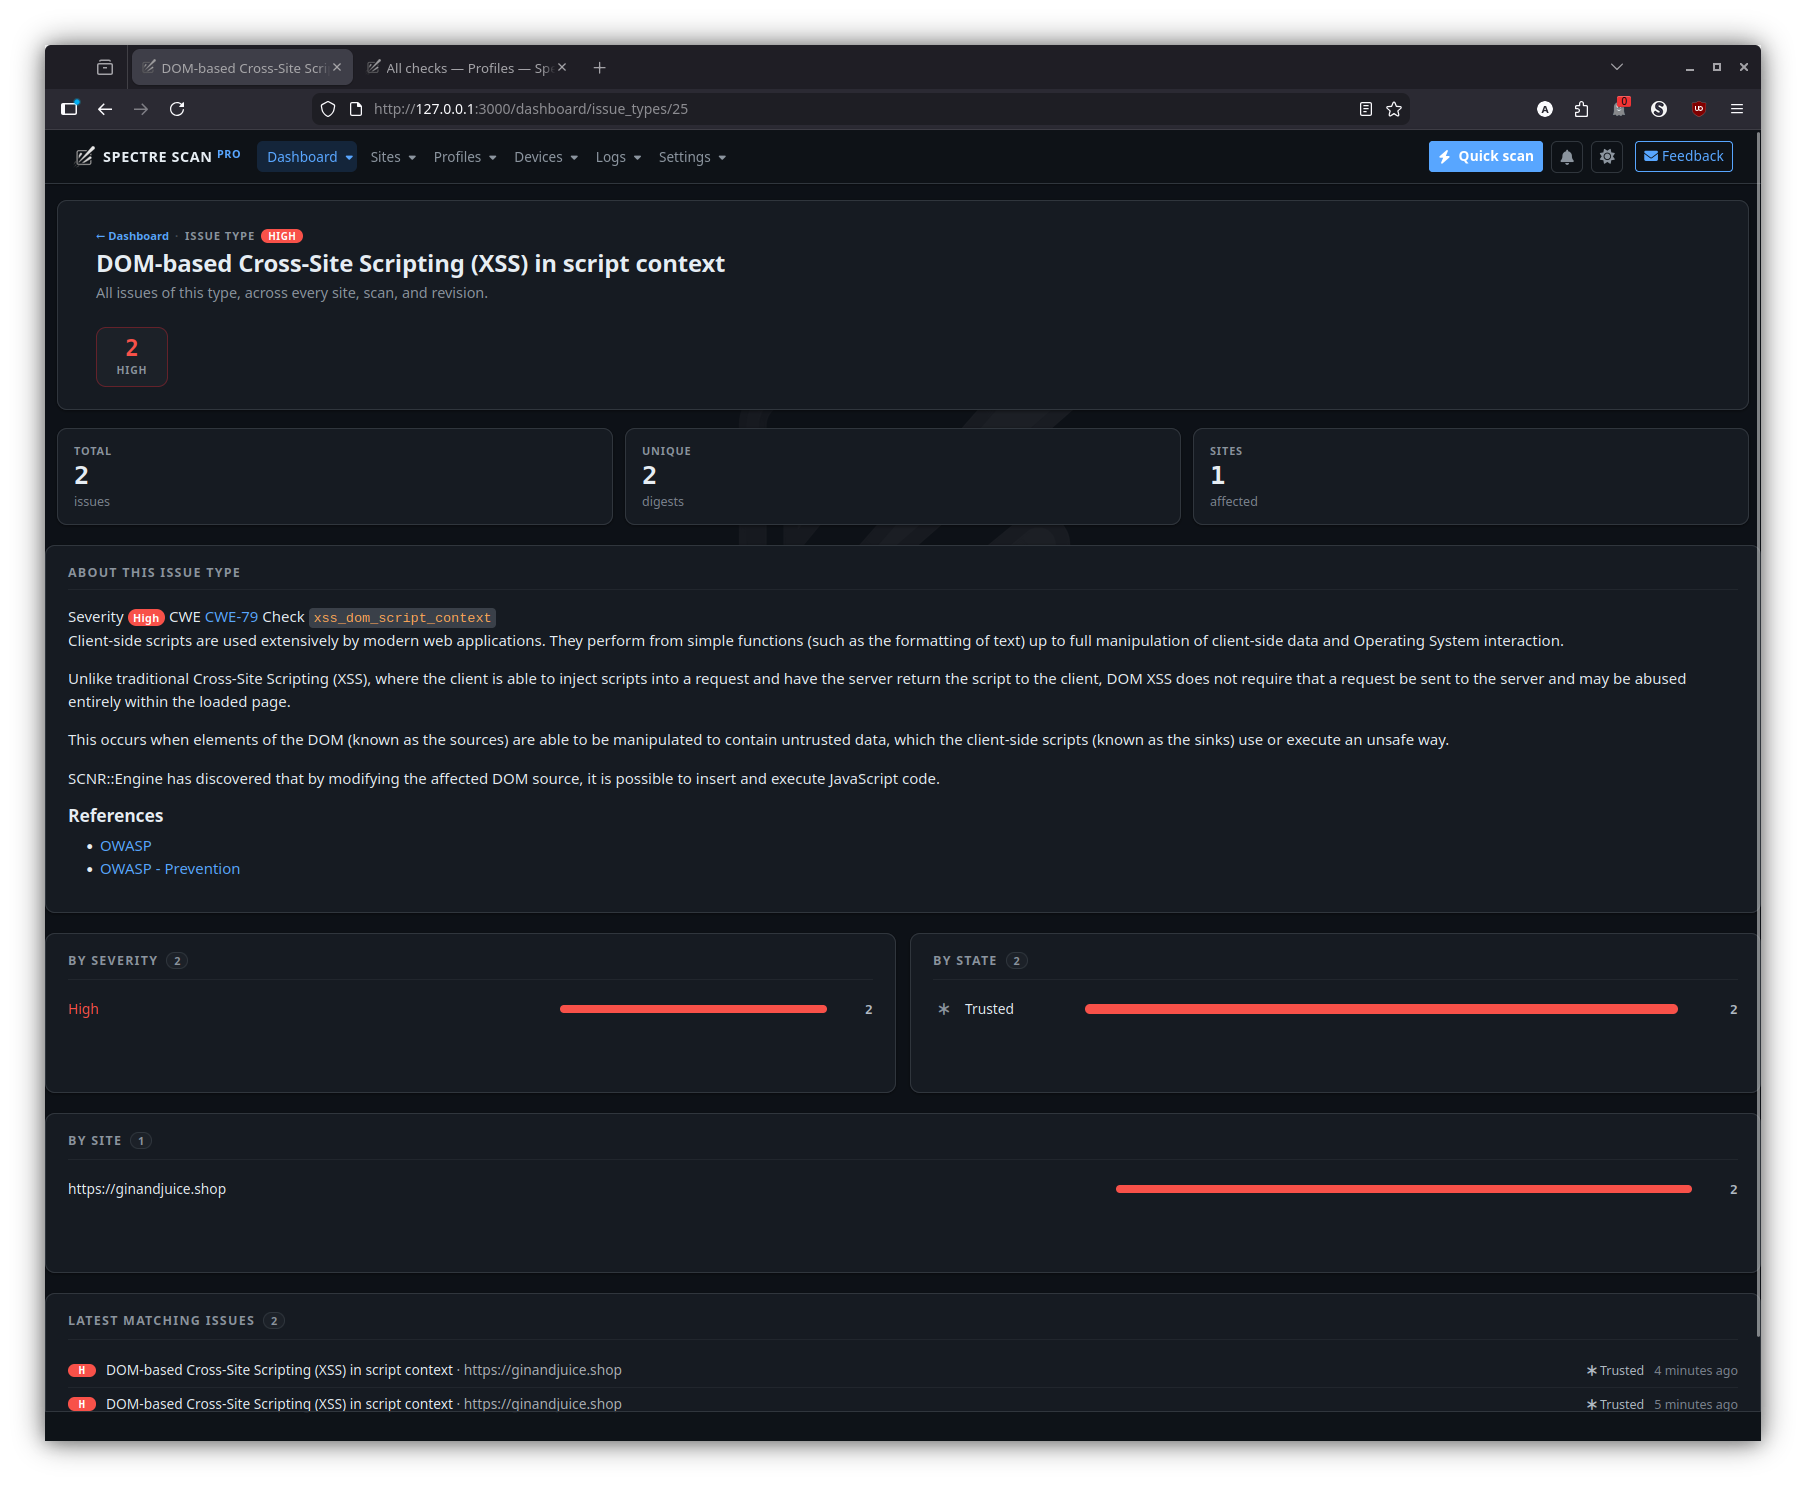
Sub-dashboard: by issue type
Rolls every issue up by check / type so you can see at a glance which weakness families dominate the picture.
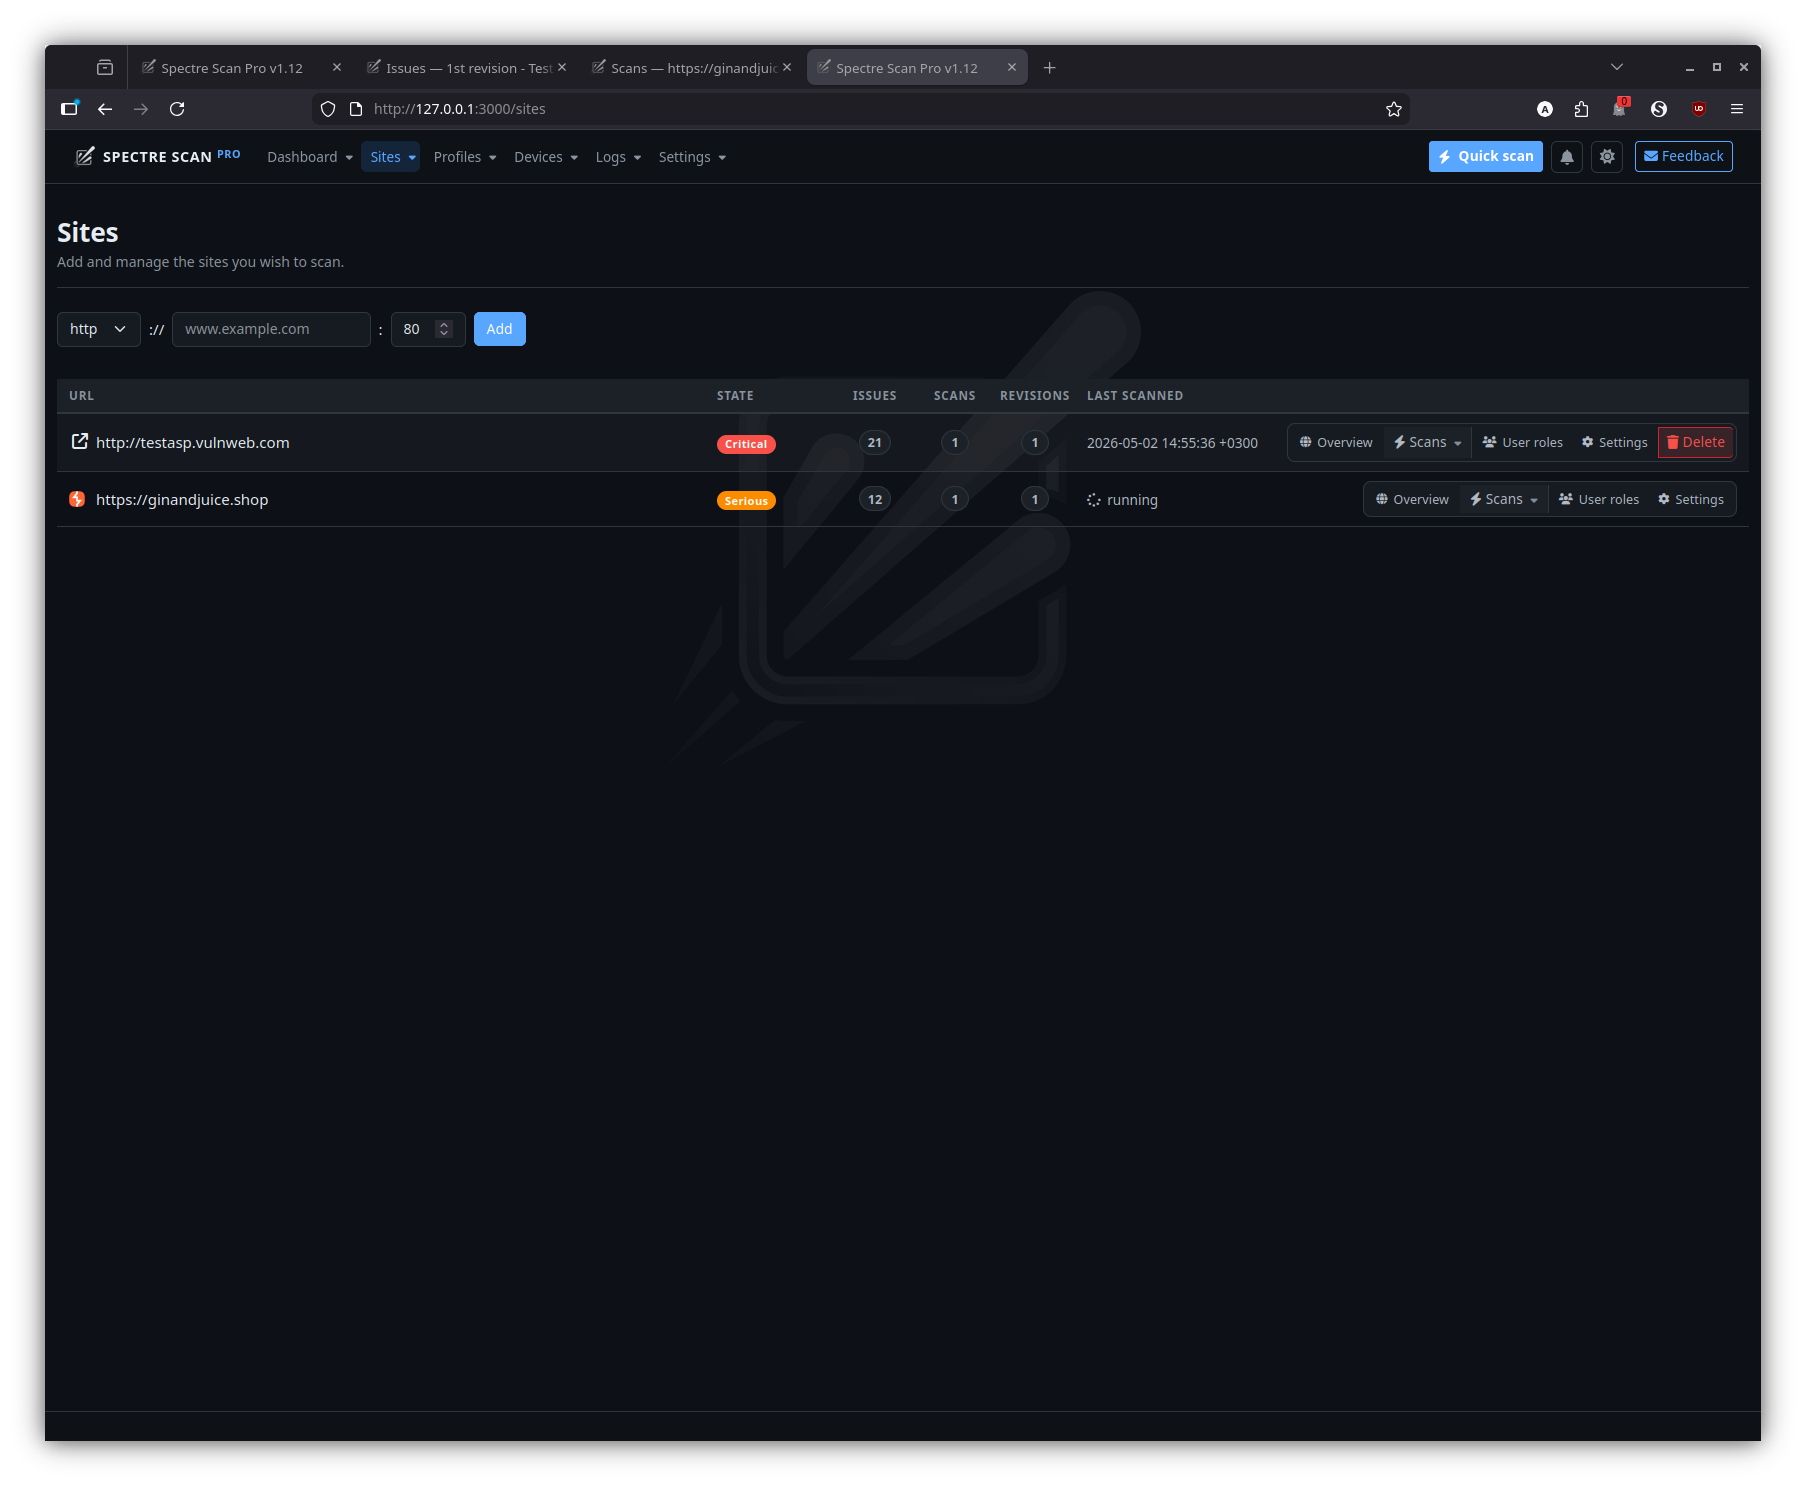
Sites
Add and manage the sites you wish to scan. Each site keeps its own profiles, devices, user roles, scans and audit history.
All sites
Site overview
The per-site landing page — a snapshot of recent revisions, severity rollup and currently-running activity for that one site.
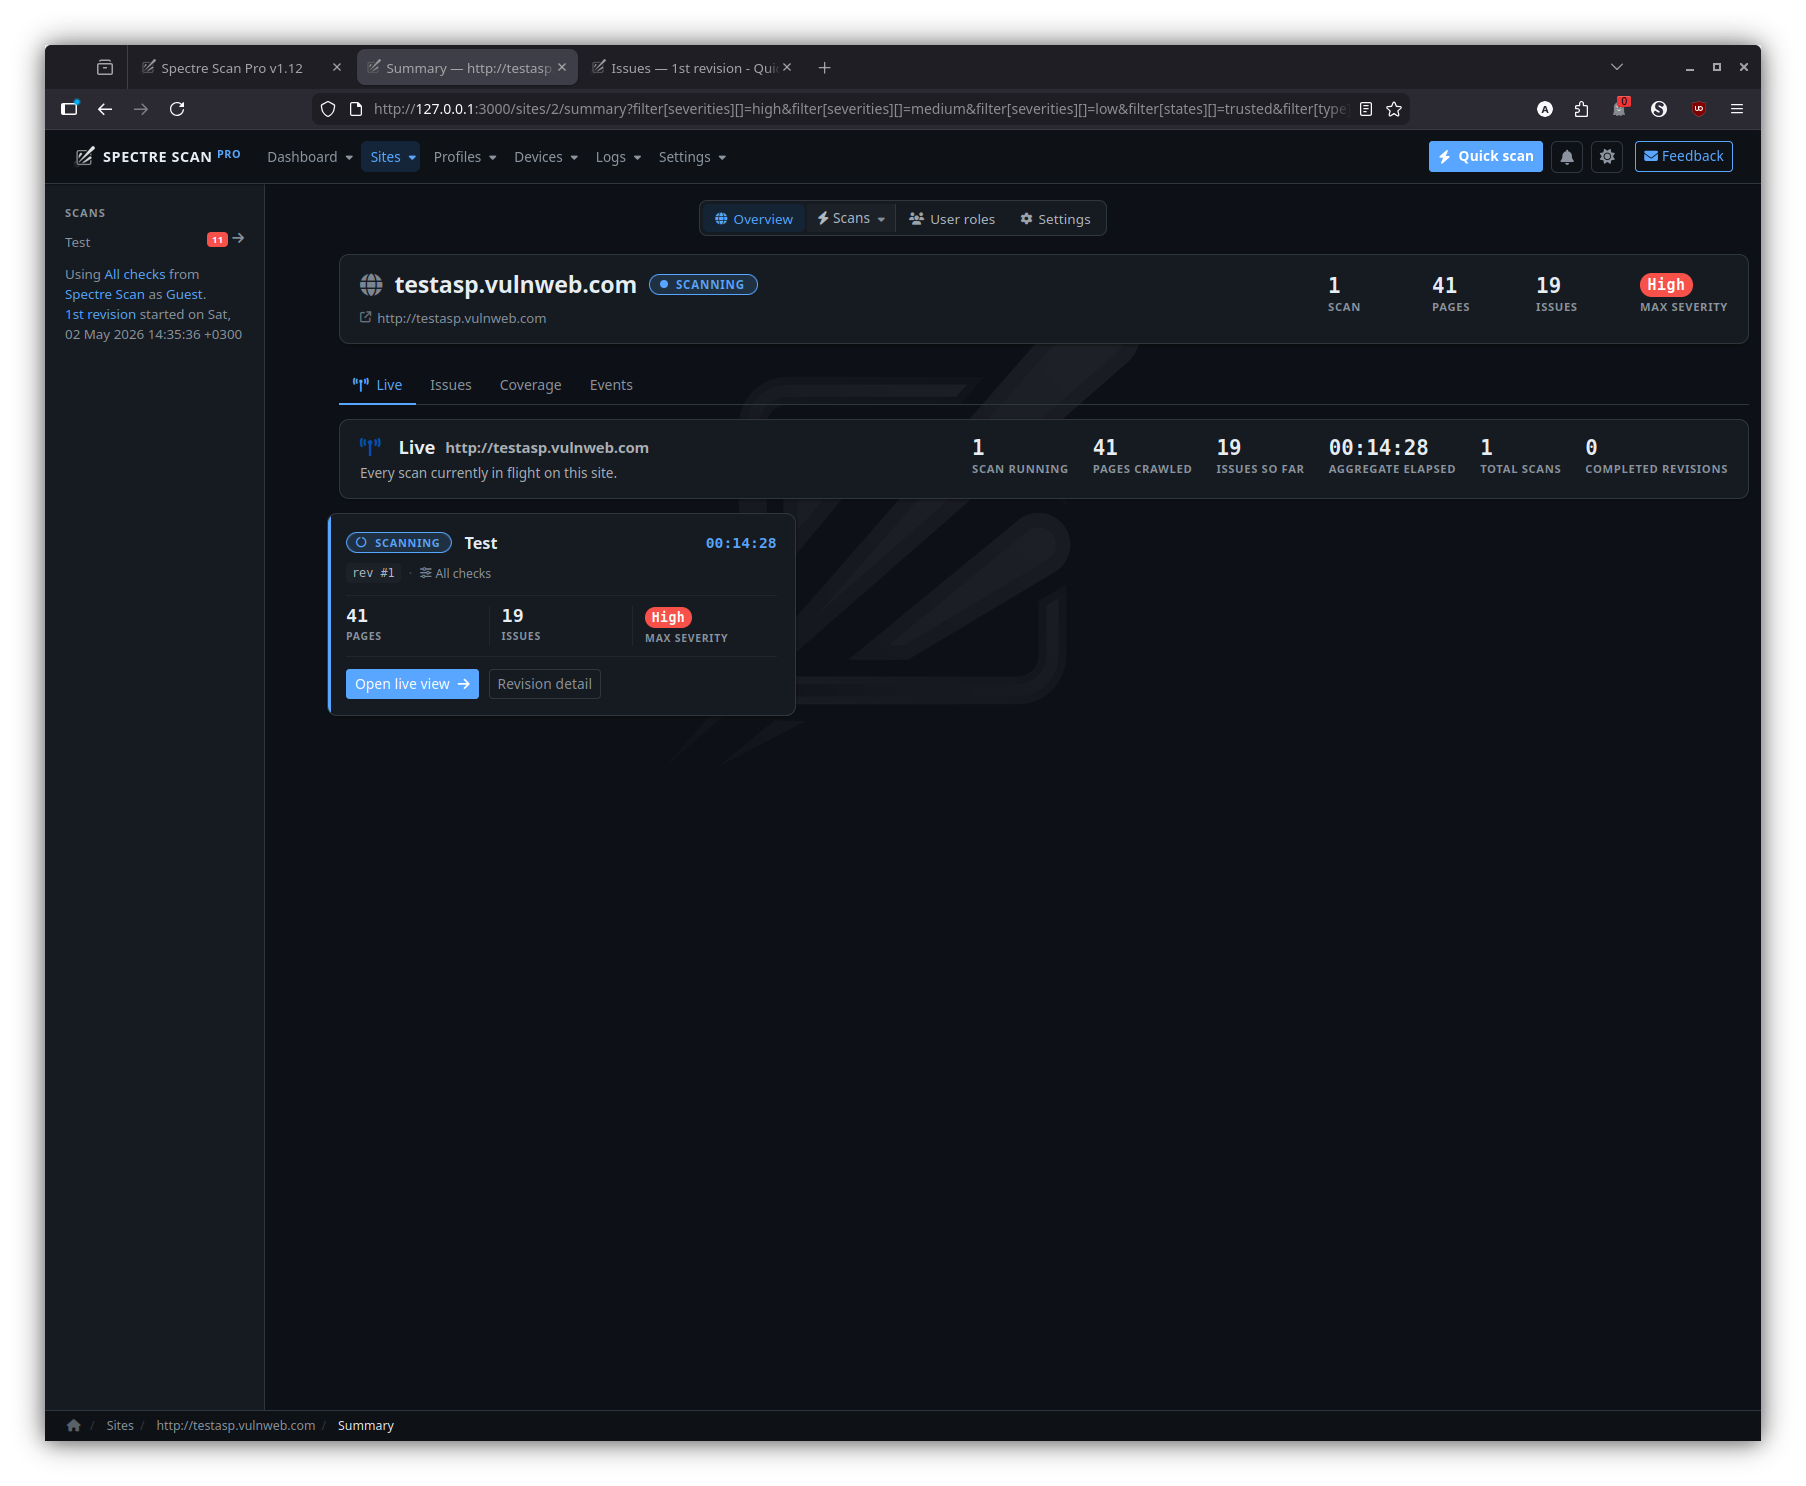
Site live status
Live progress for the site’s currently-running scan, updated in real-time over Action Cable.
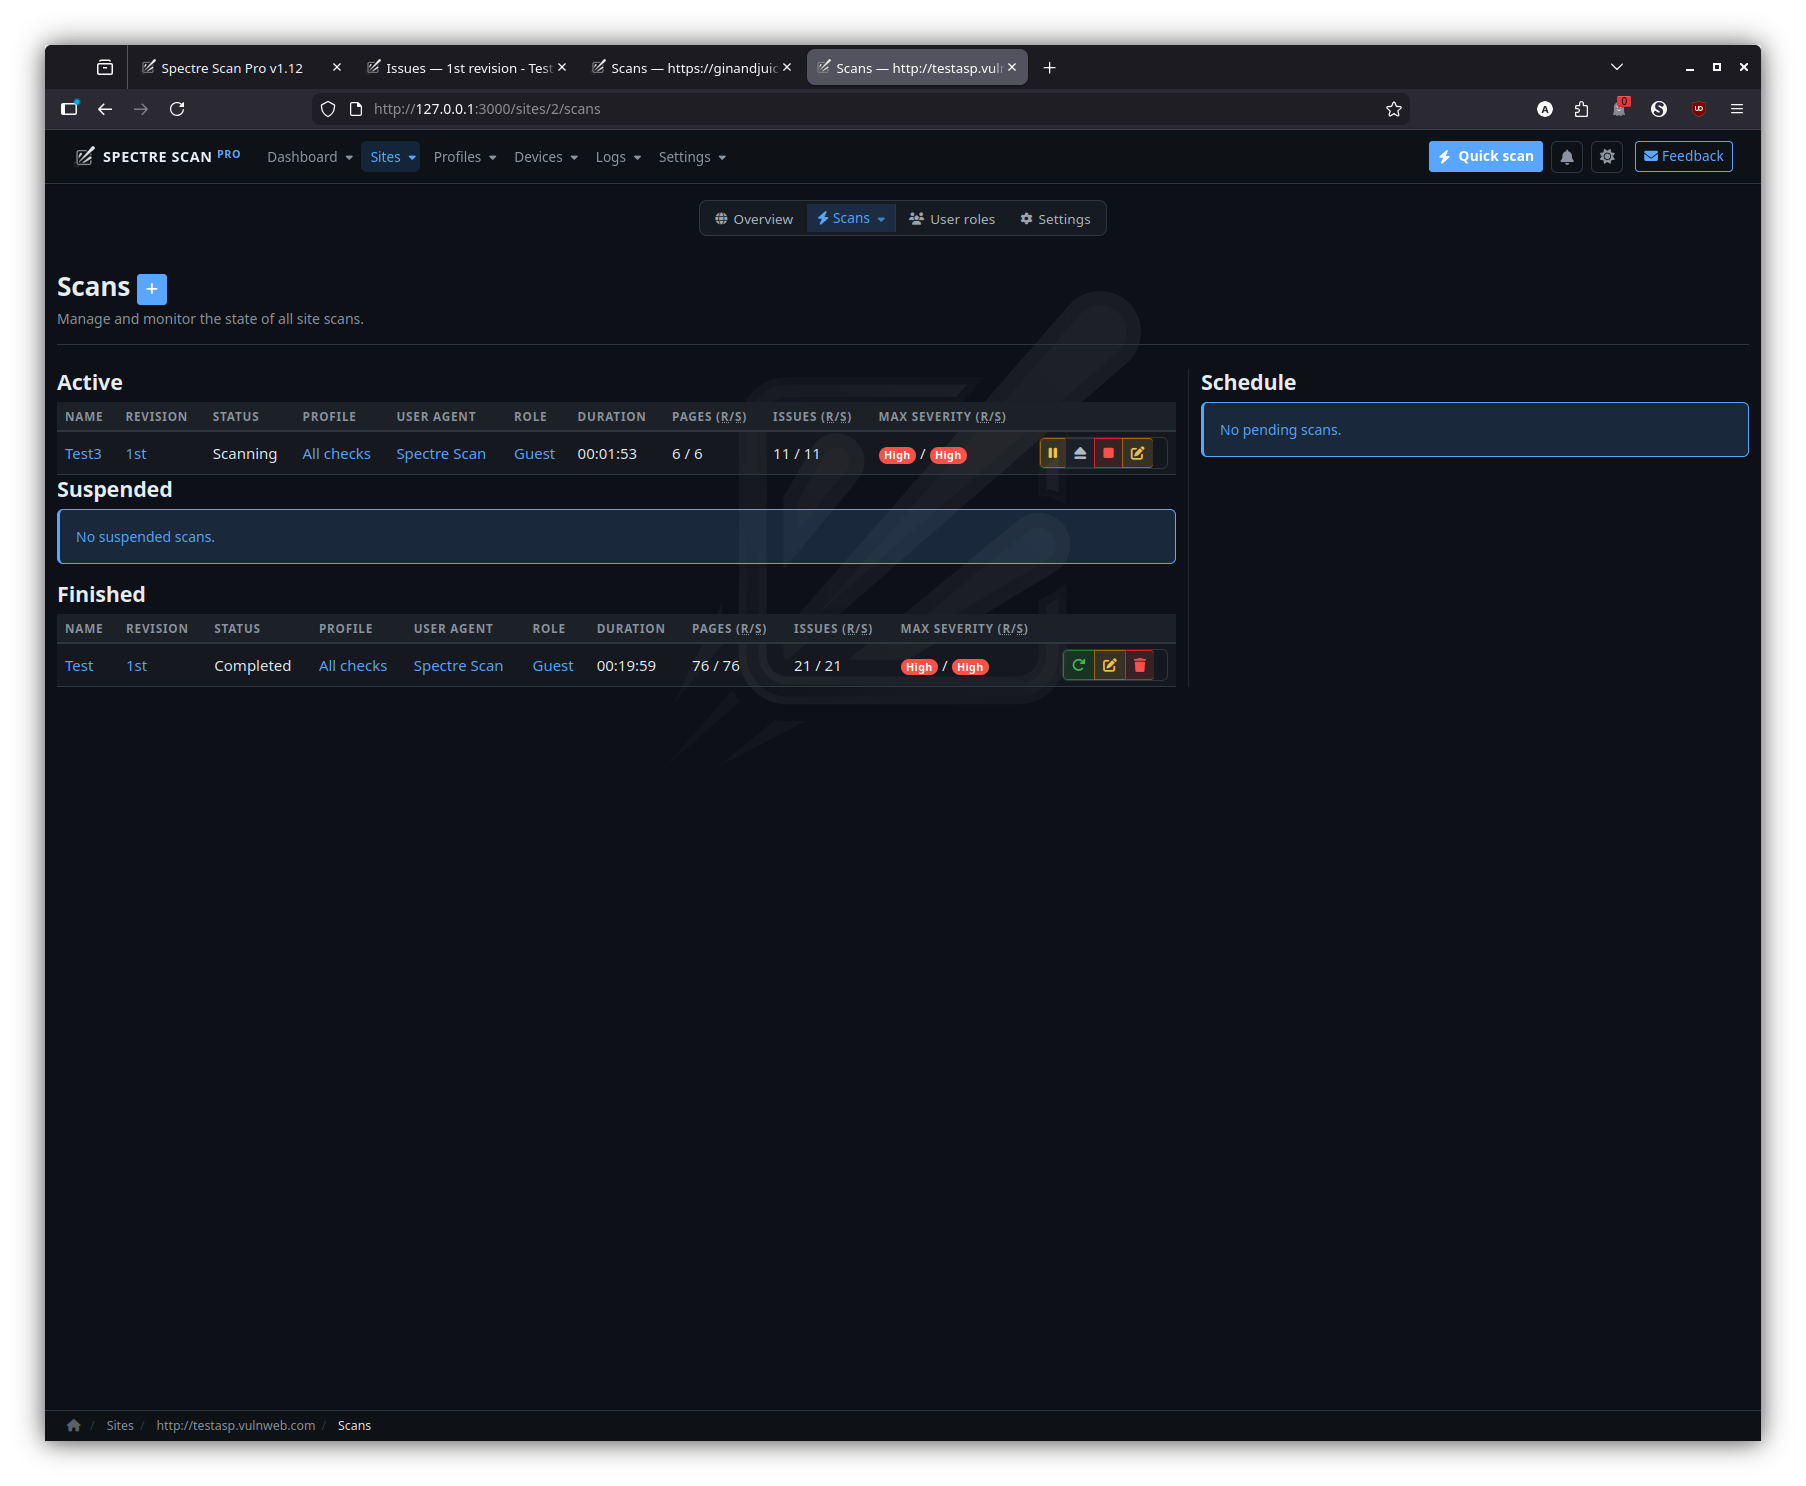
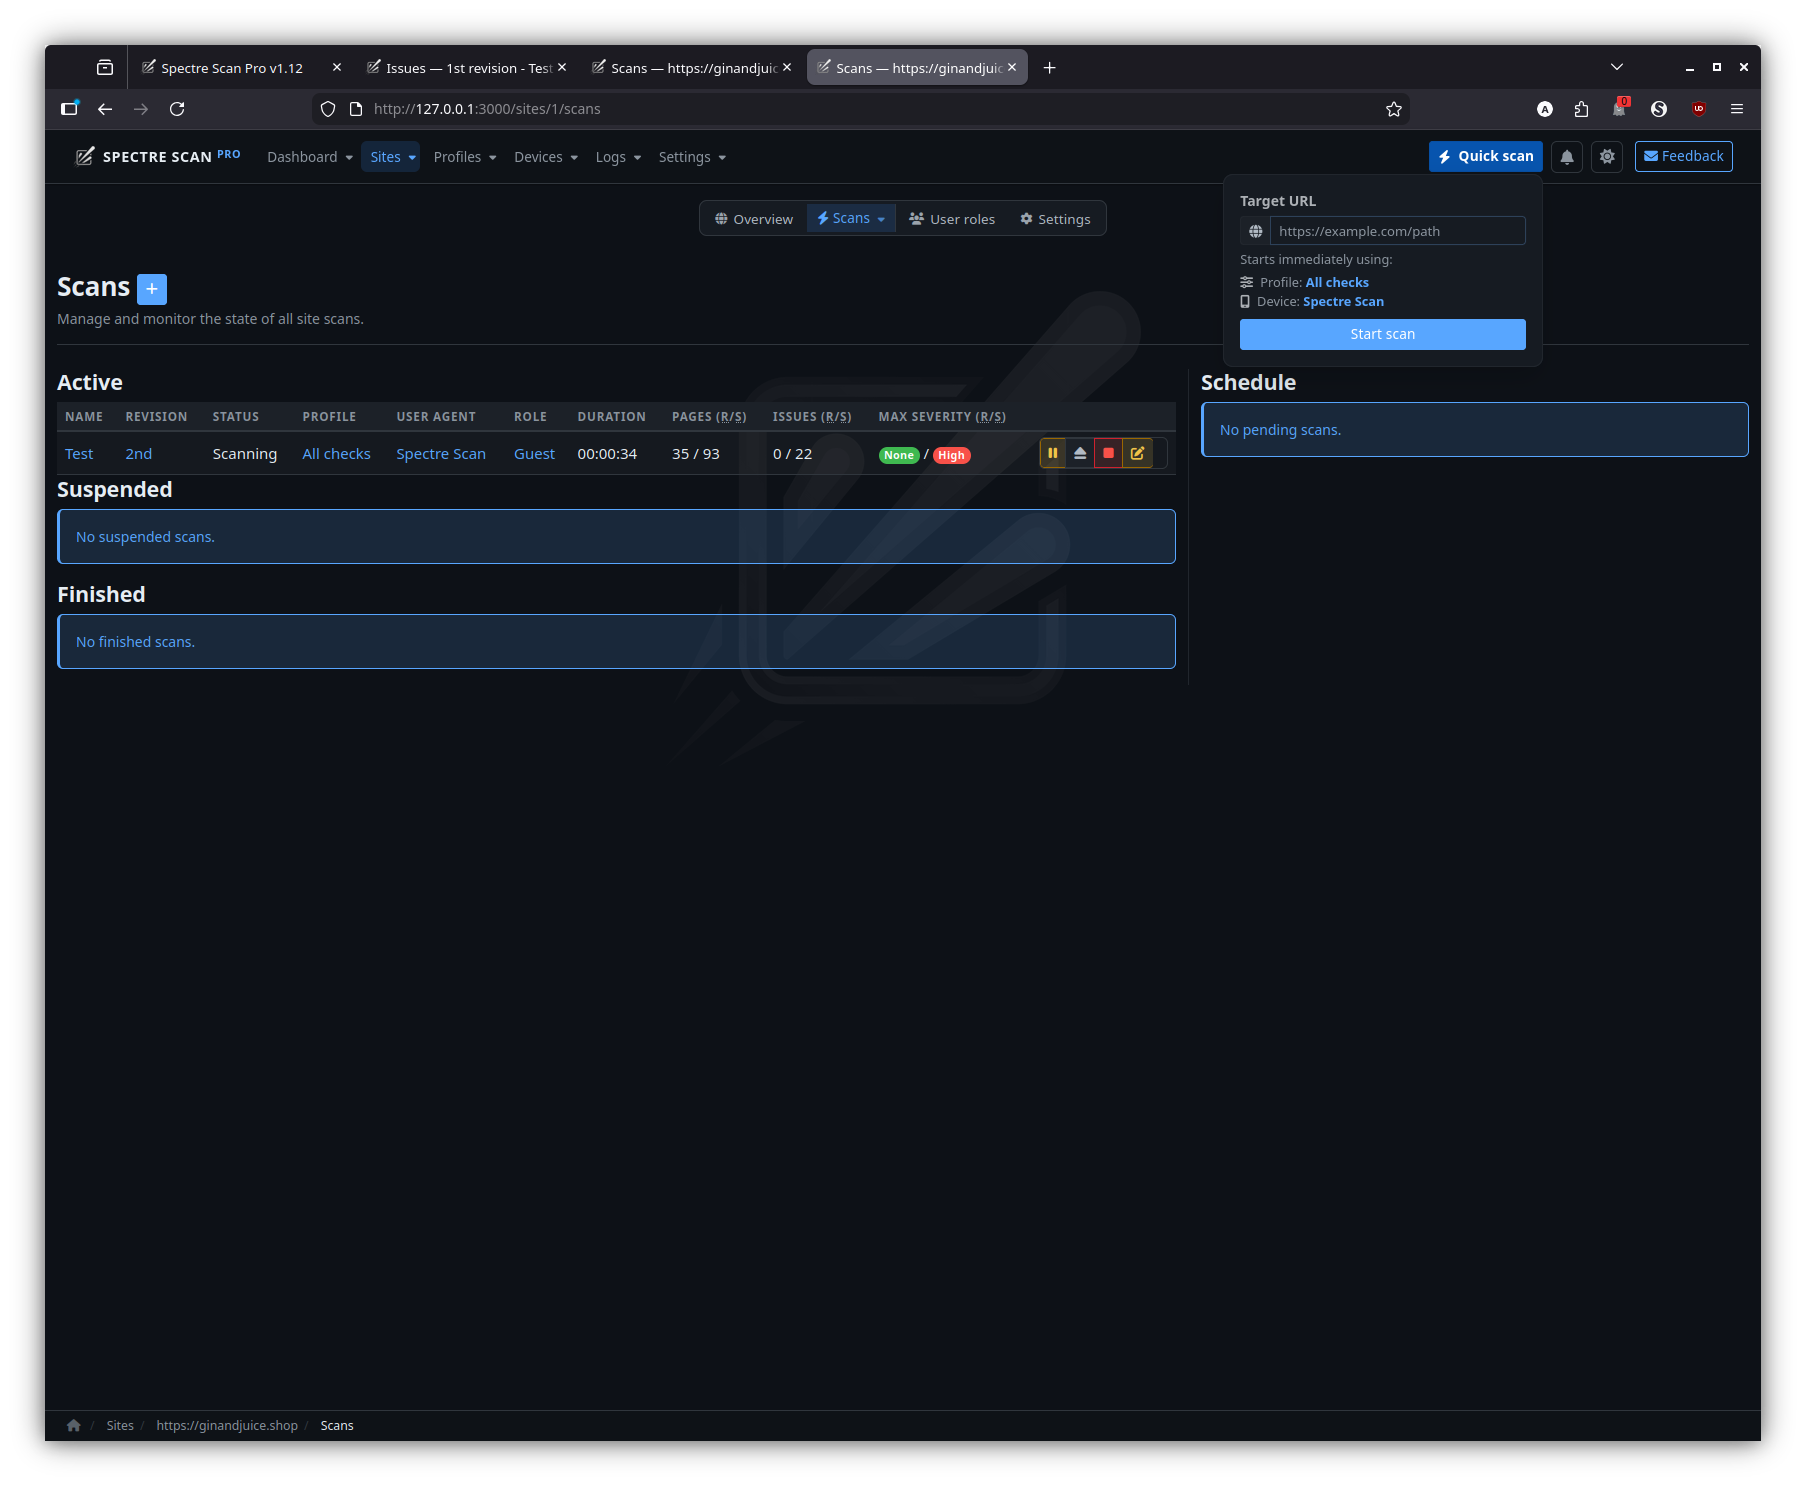
Site scans
The full scan list for a site, grouped by Active / Suspended / Finished / Schedule.
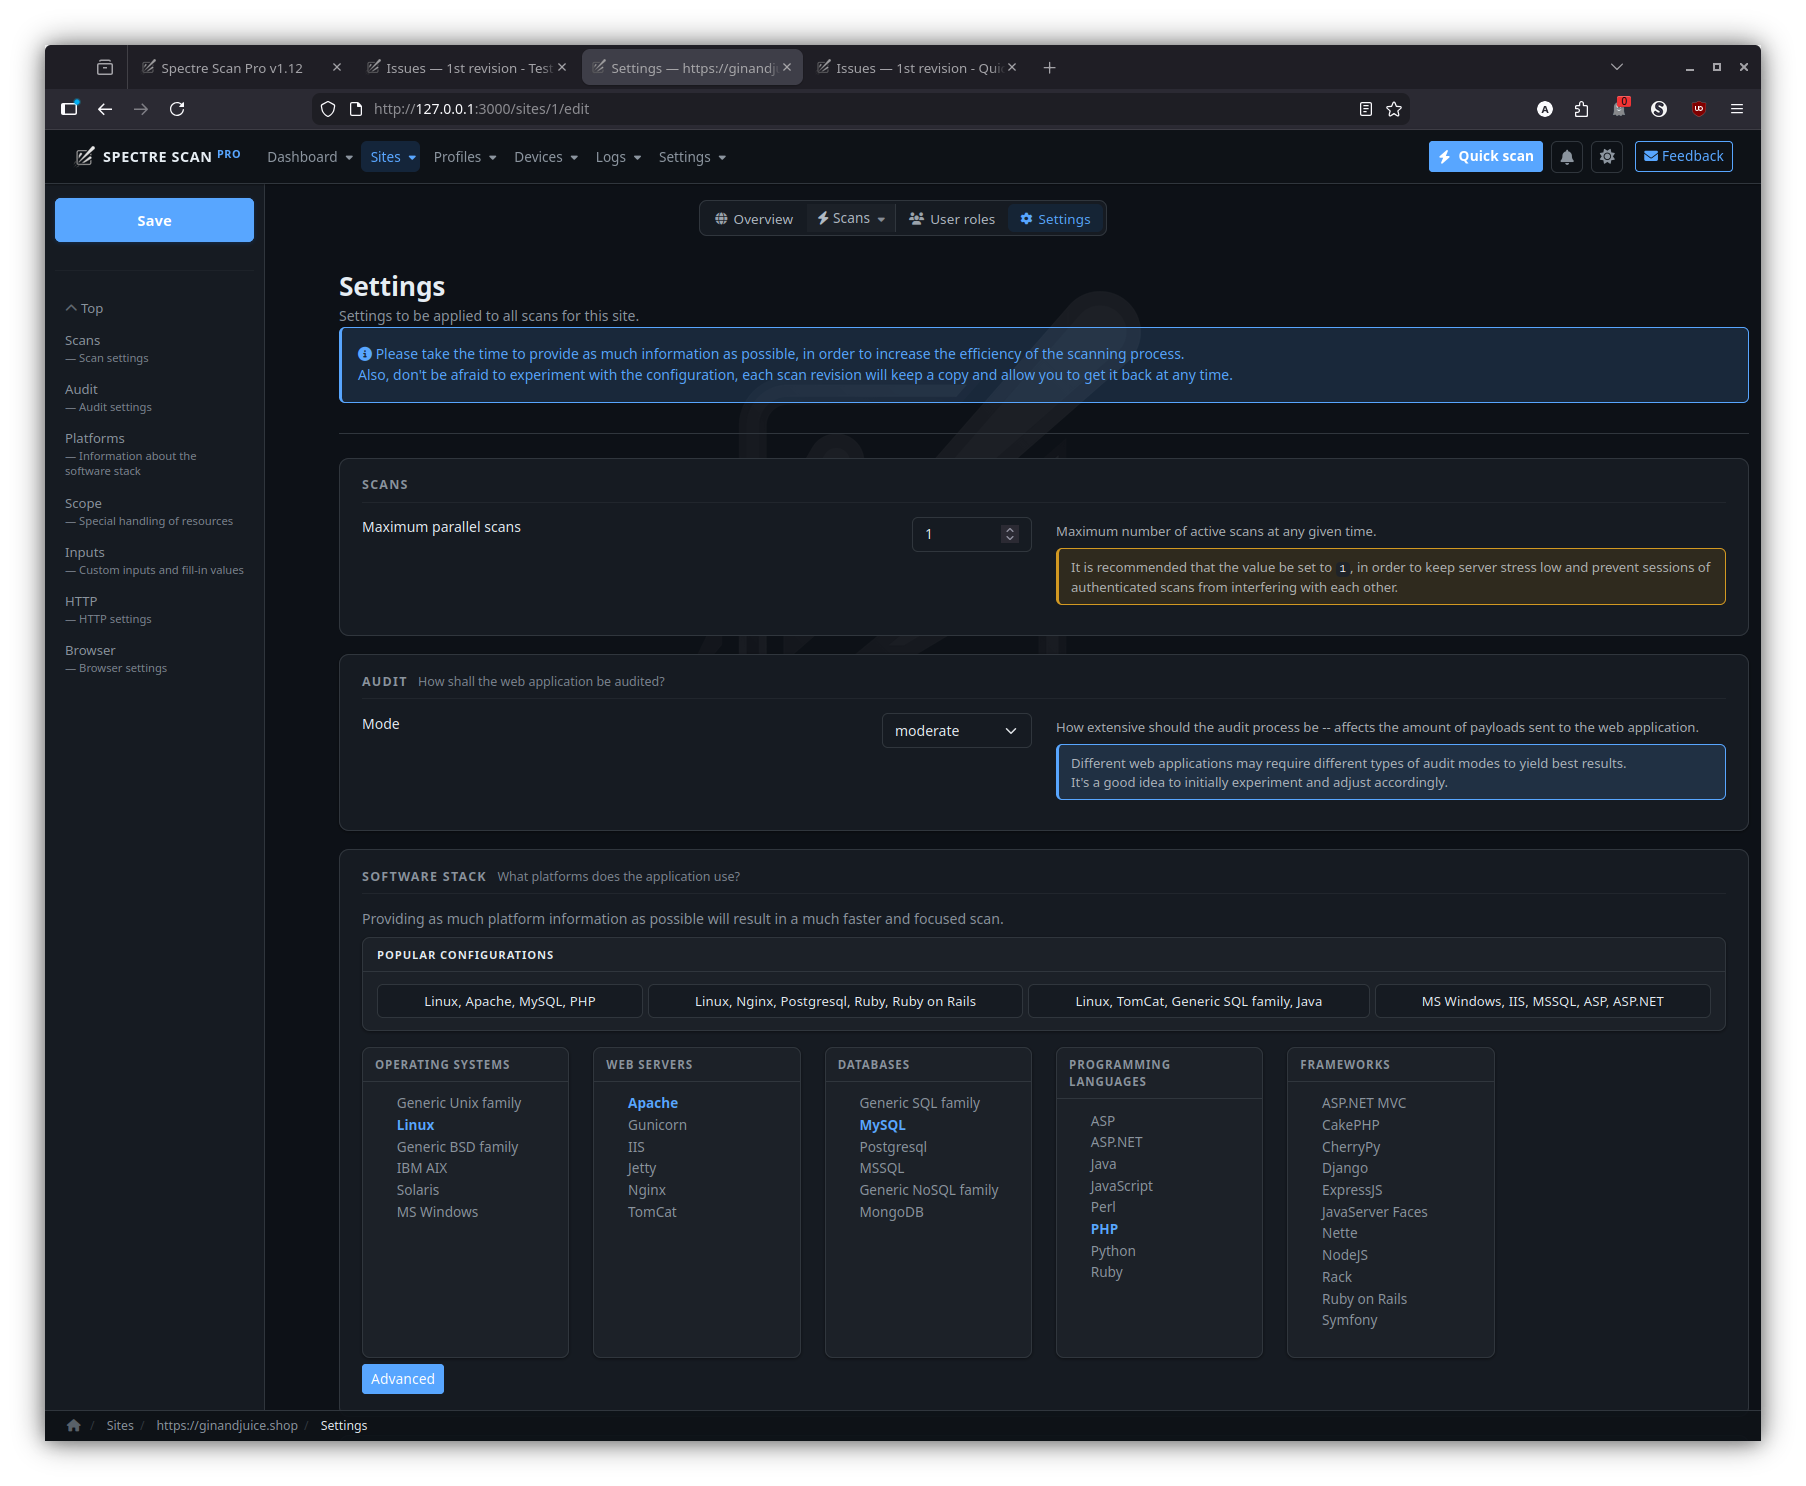
Site settings
Per-site knobs: protocol, host, port, default profile, default device and inherited scope rules.
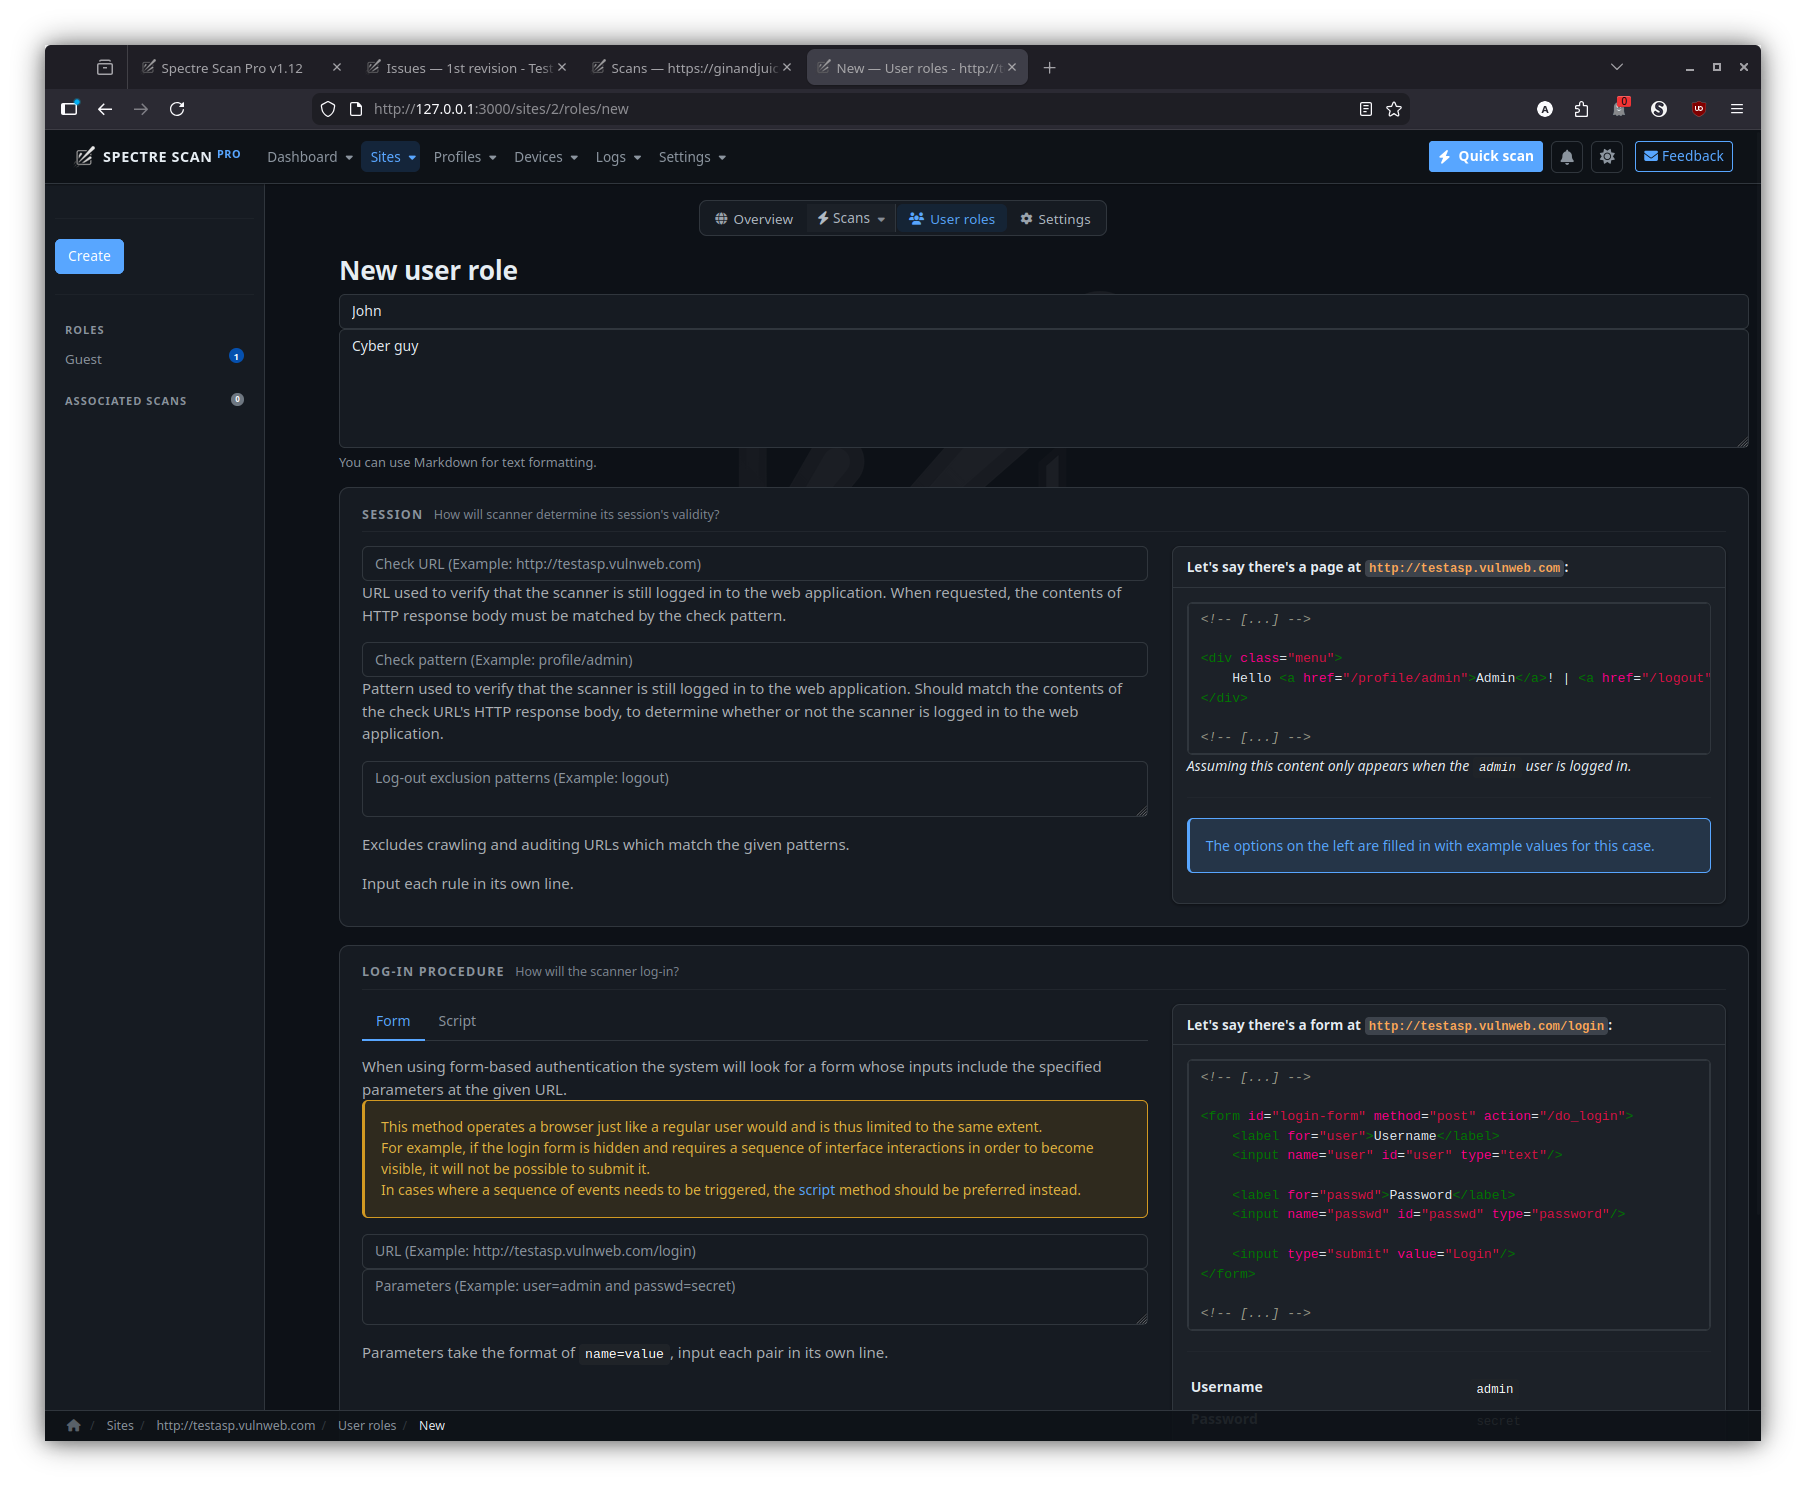
User roles
Manage authenticated personas the scanner can assume — handy for testing role-gated parts of the application.
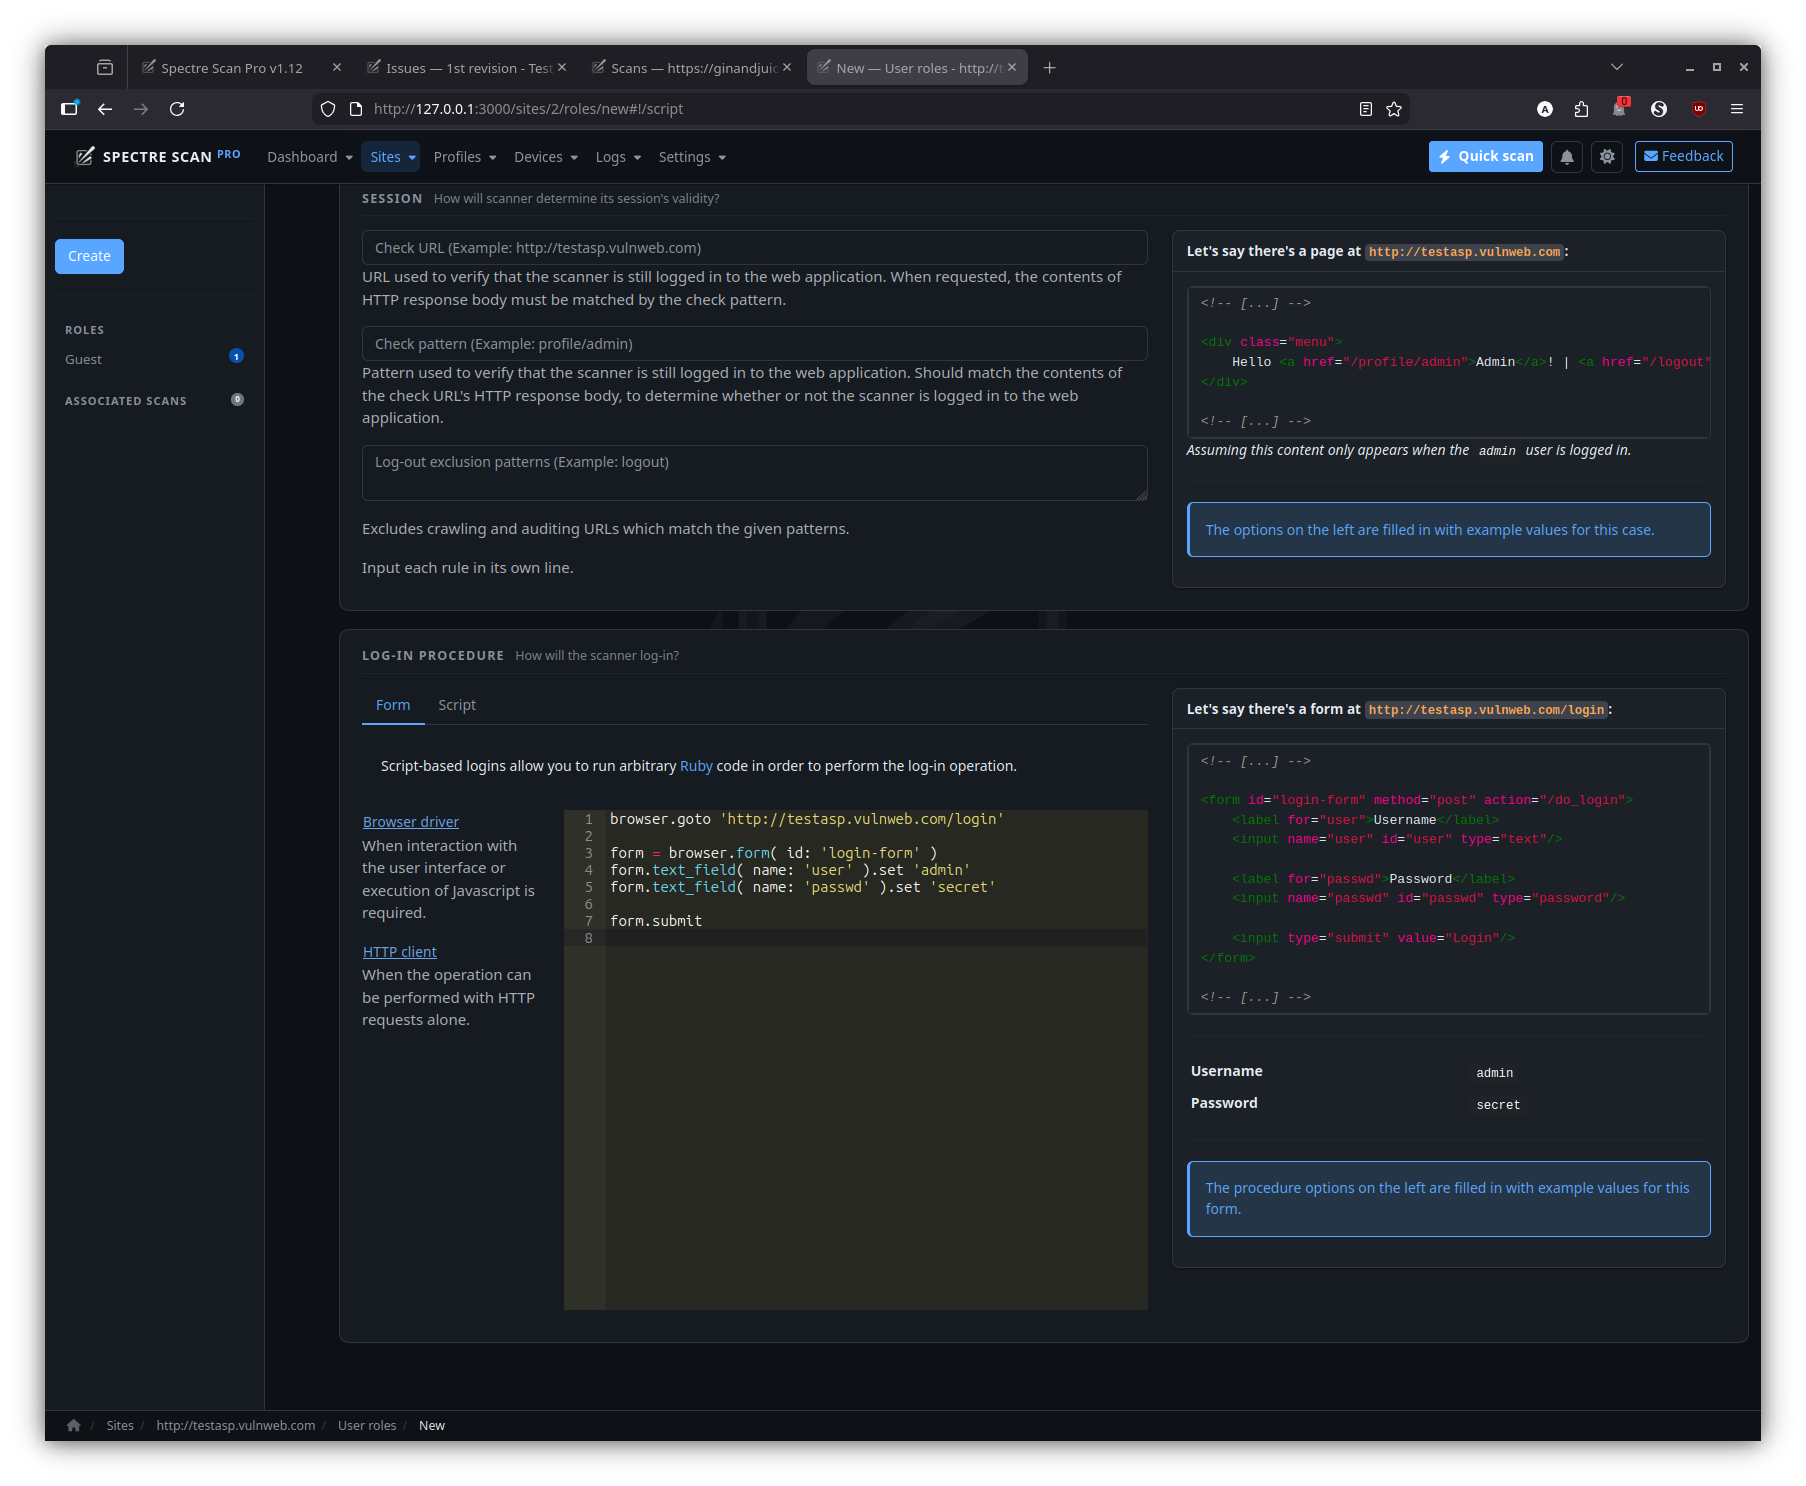
Script-based login
When form-based login isn’t enough, drop in a Ruby snippet using a prepared browser driver or HTTP client.
Scans
Configure, schedule, monitor and re-run scans.
Quick scan
The navbar’s quick-scan widget — one URL away from a default-profile scan against a brand-new or existing site.
New scan
The full configuration form: profile, device, role, schedule, custom scope, plug-ins.
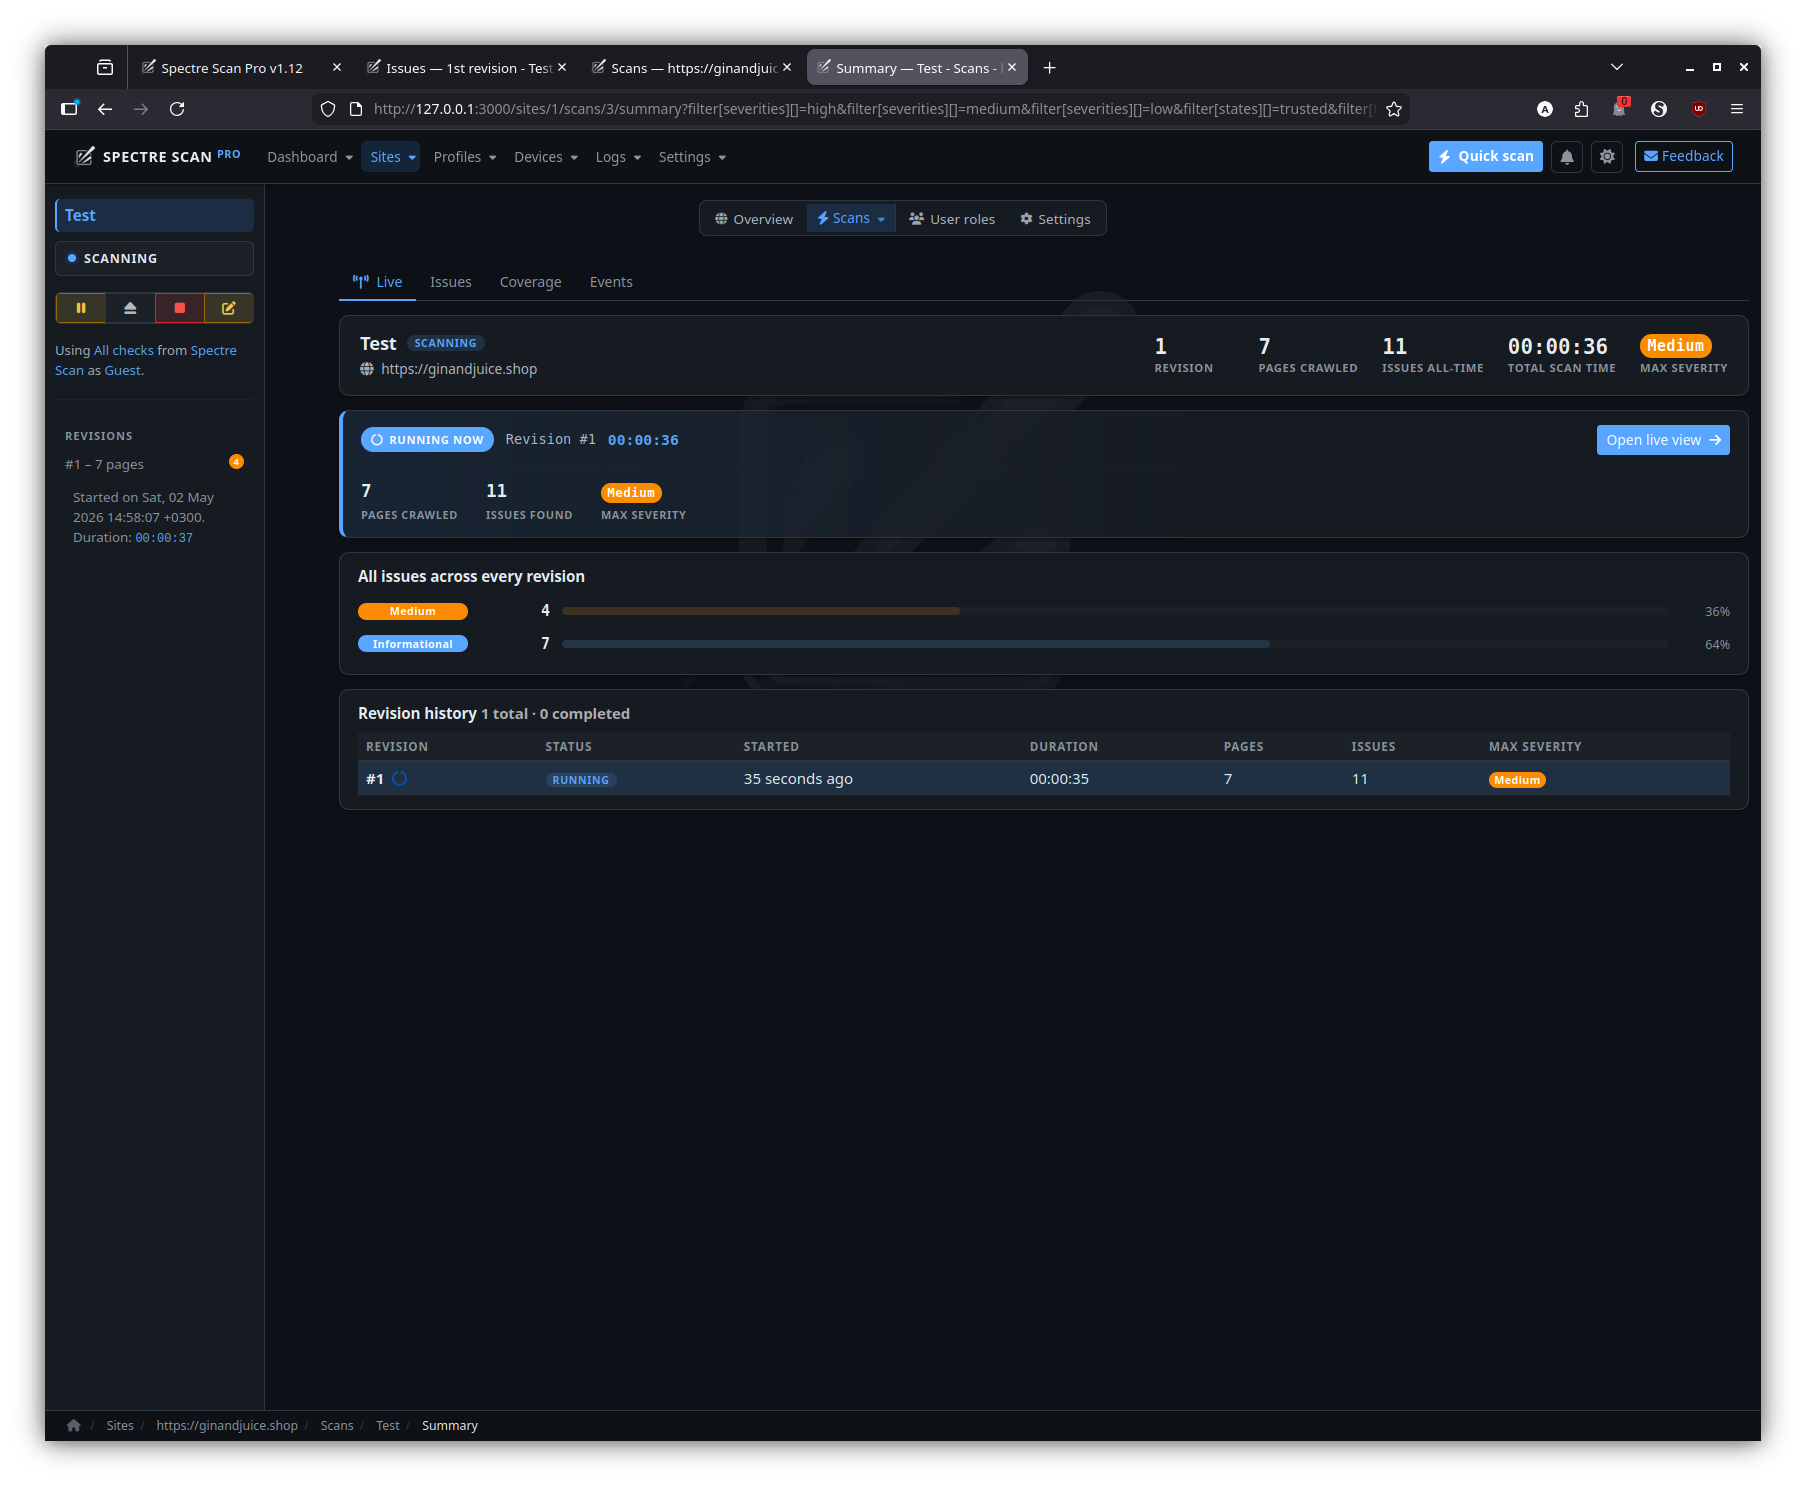
Scan live
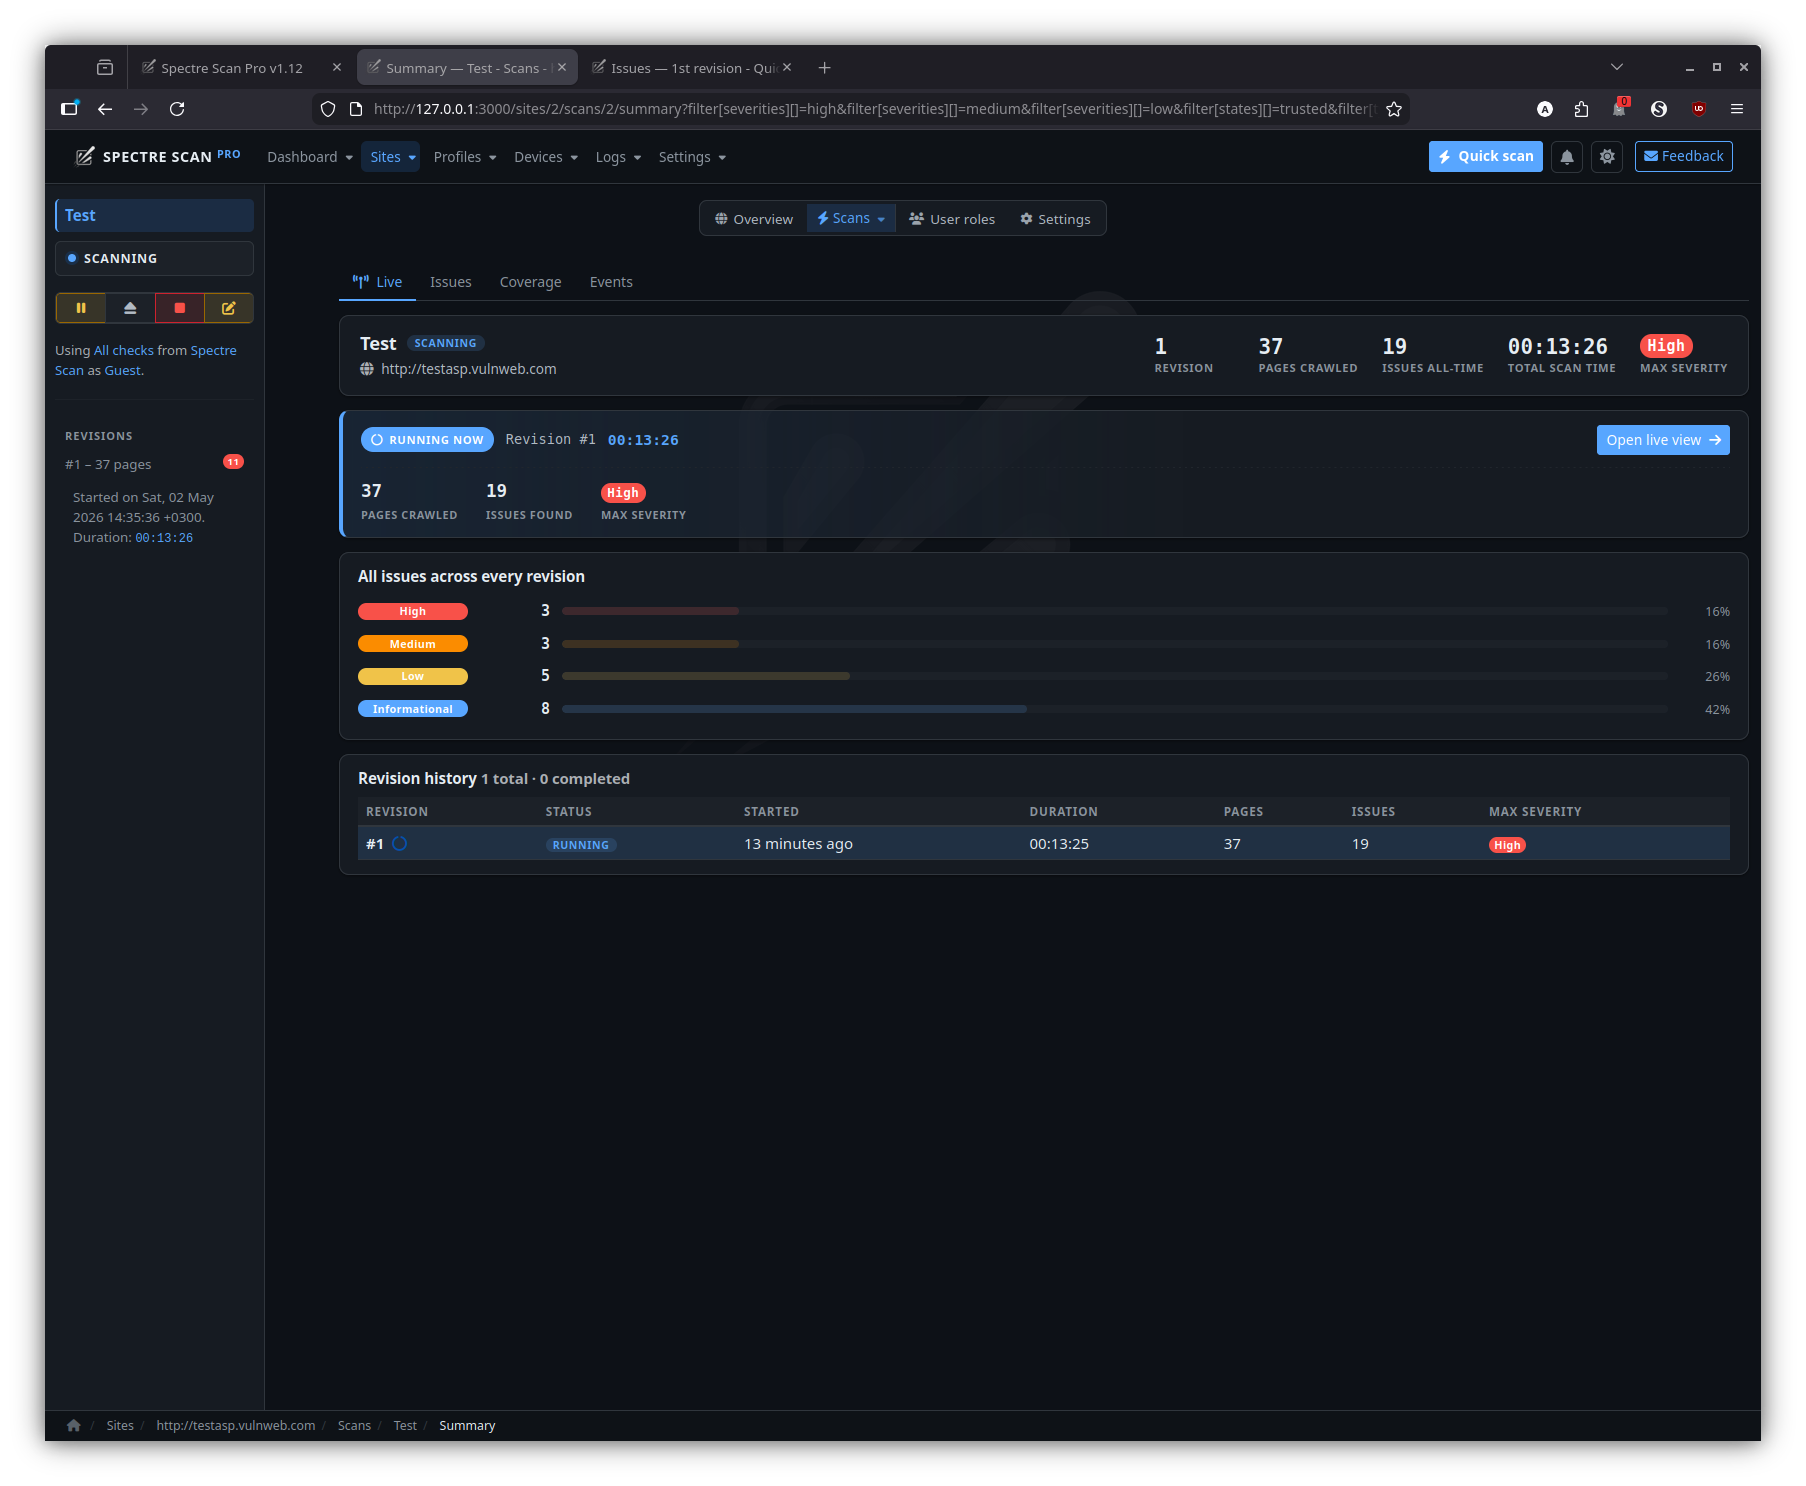
Live scan progress at the scan level — running revision, queue stats, discovered pages, issues found so far.
Generic live view
Live status surface used both for site-wide and scan-wide live monitoring.
Revisions
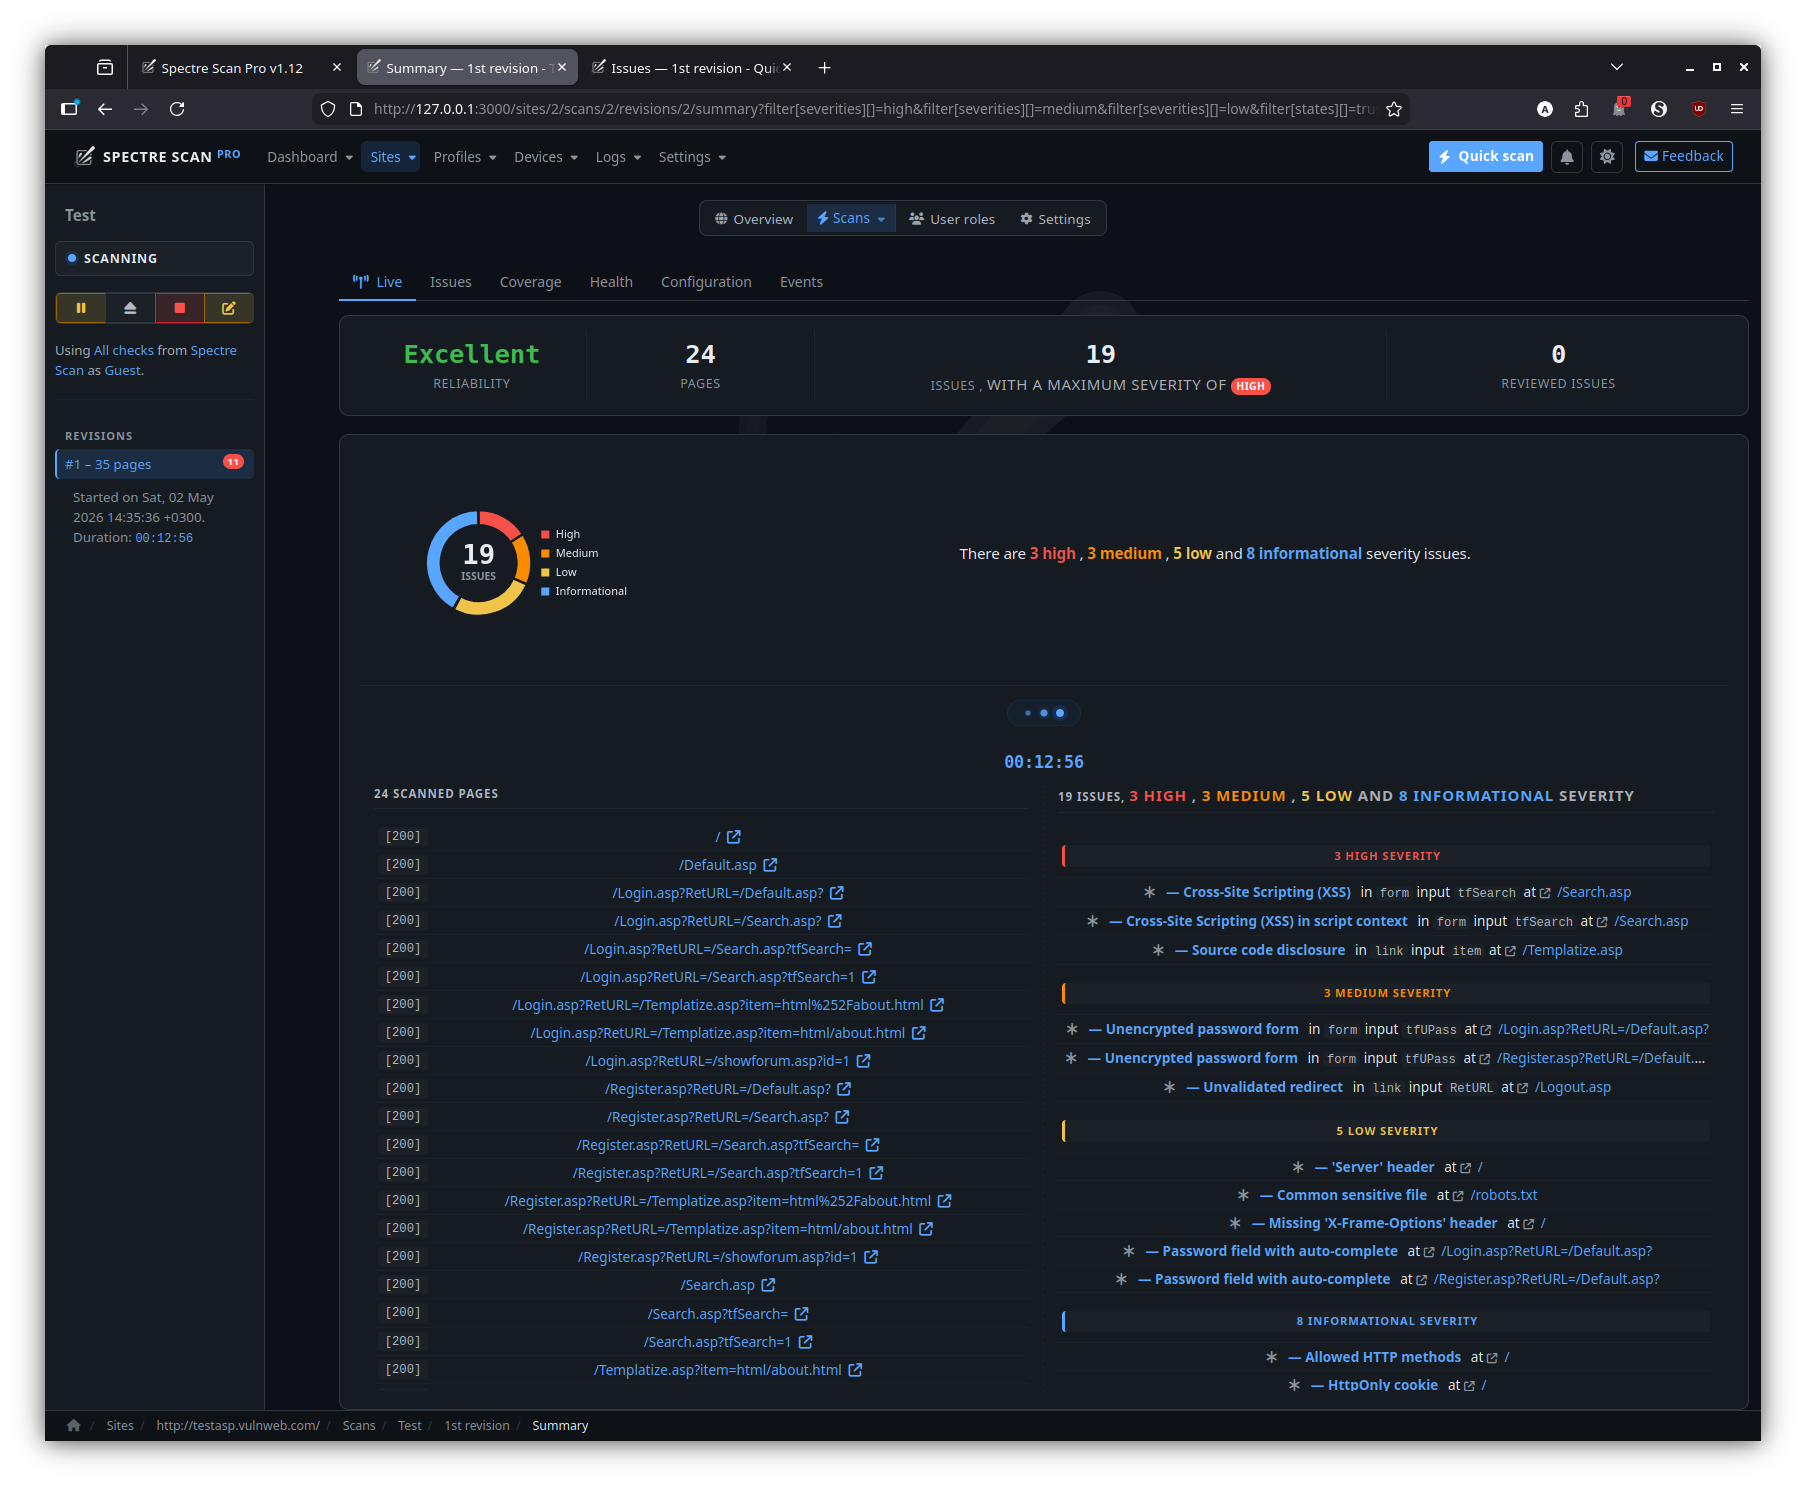
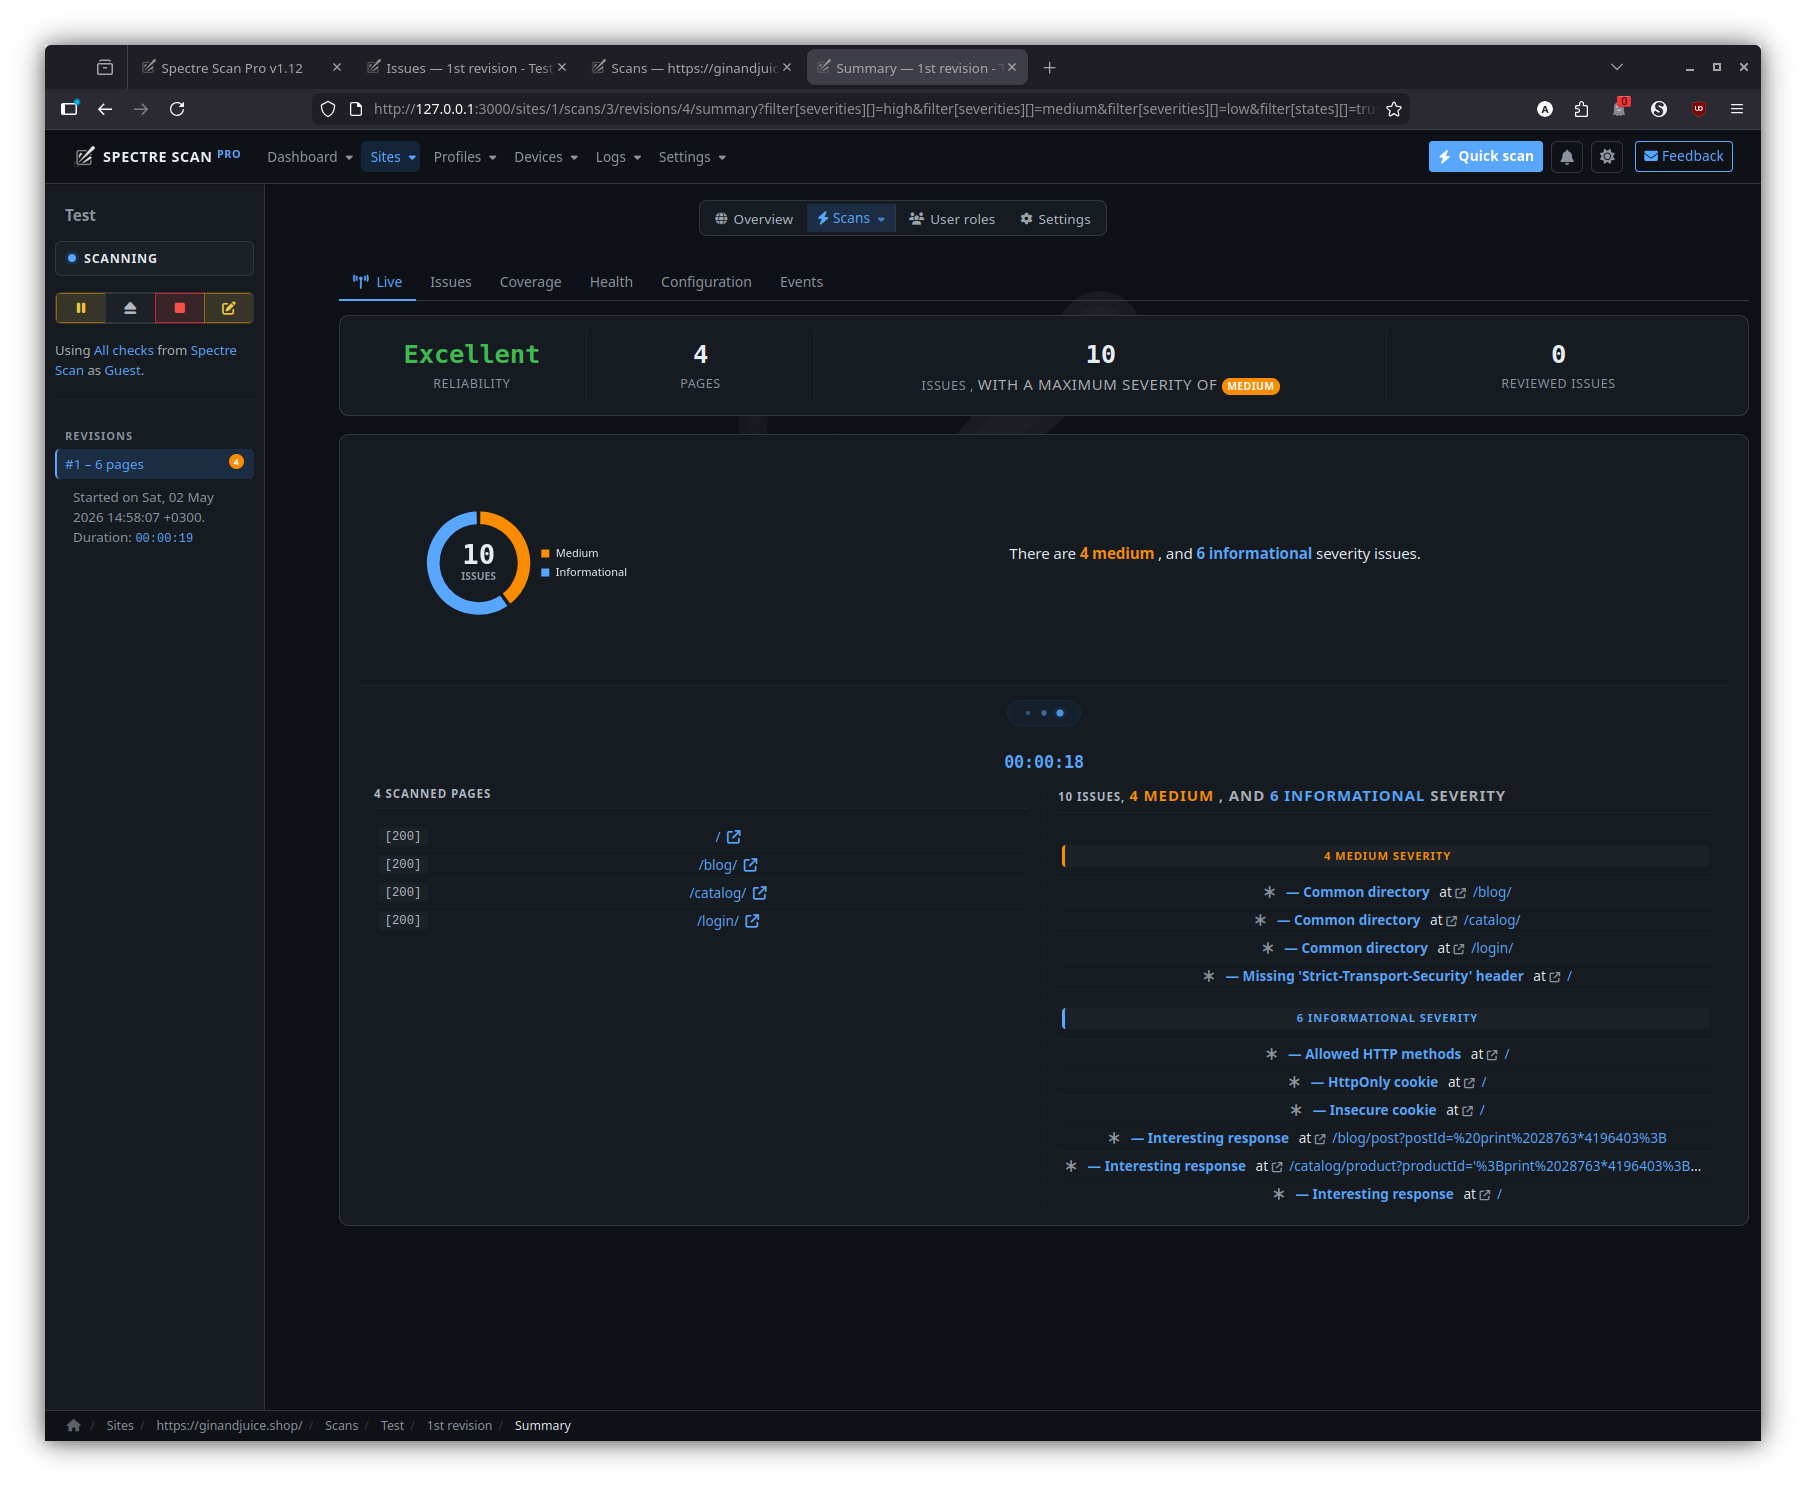
Each scan produces revisions — incremental snapshots of the same target. Revisions are where issues, coverage and reports actually live.
Revision — live
Live monitoring of an individual revision while it scans.
Revision — issues
The issue listing for a single revision, with severity / state / type filters.
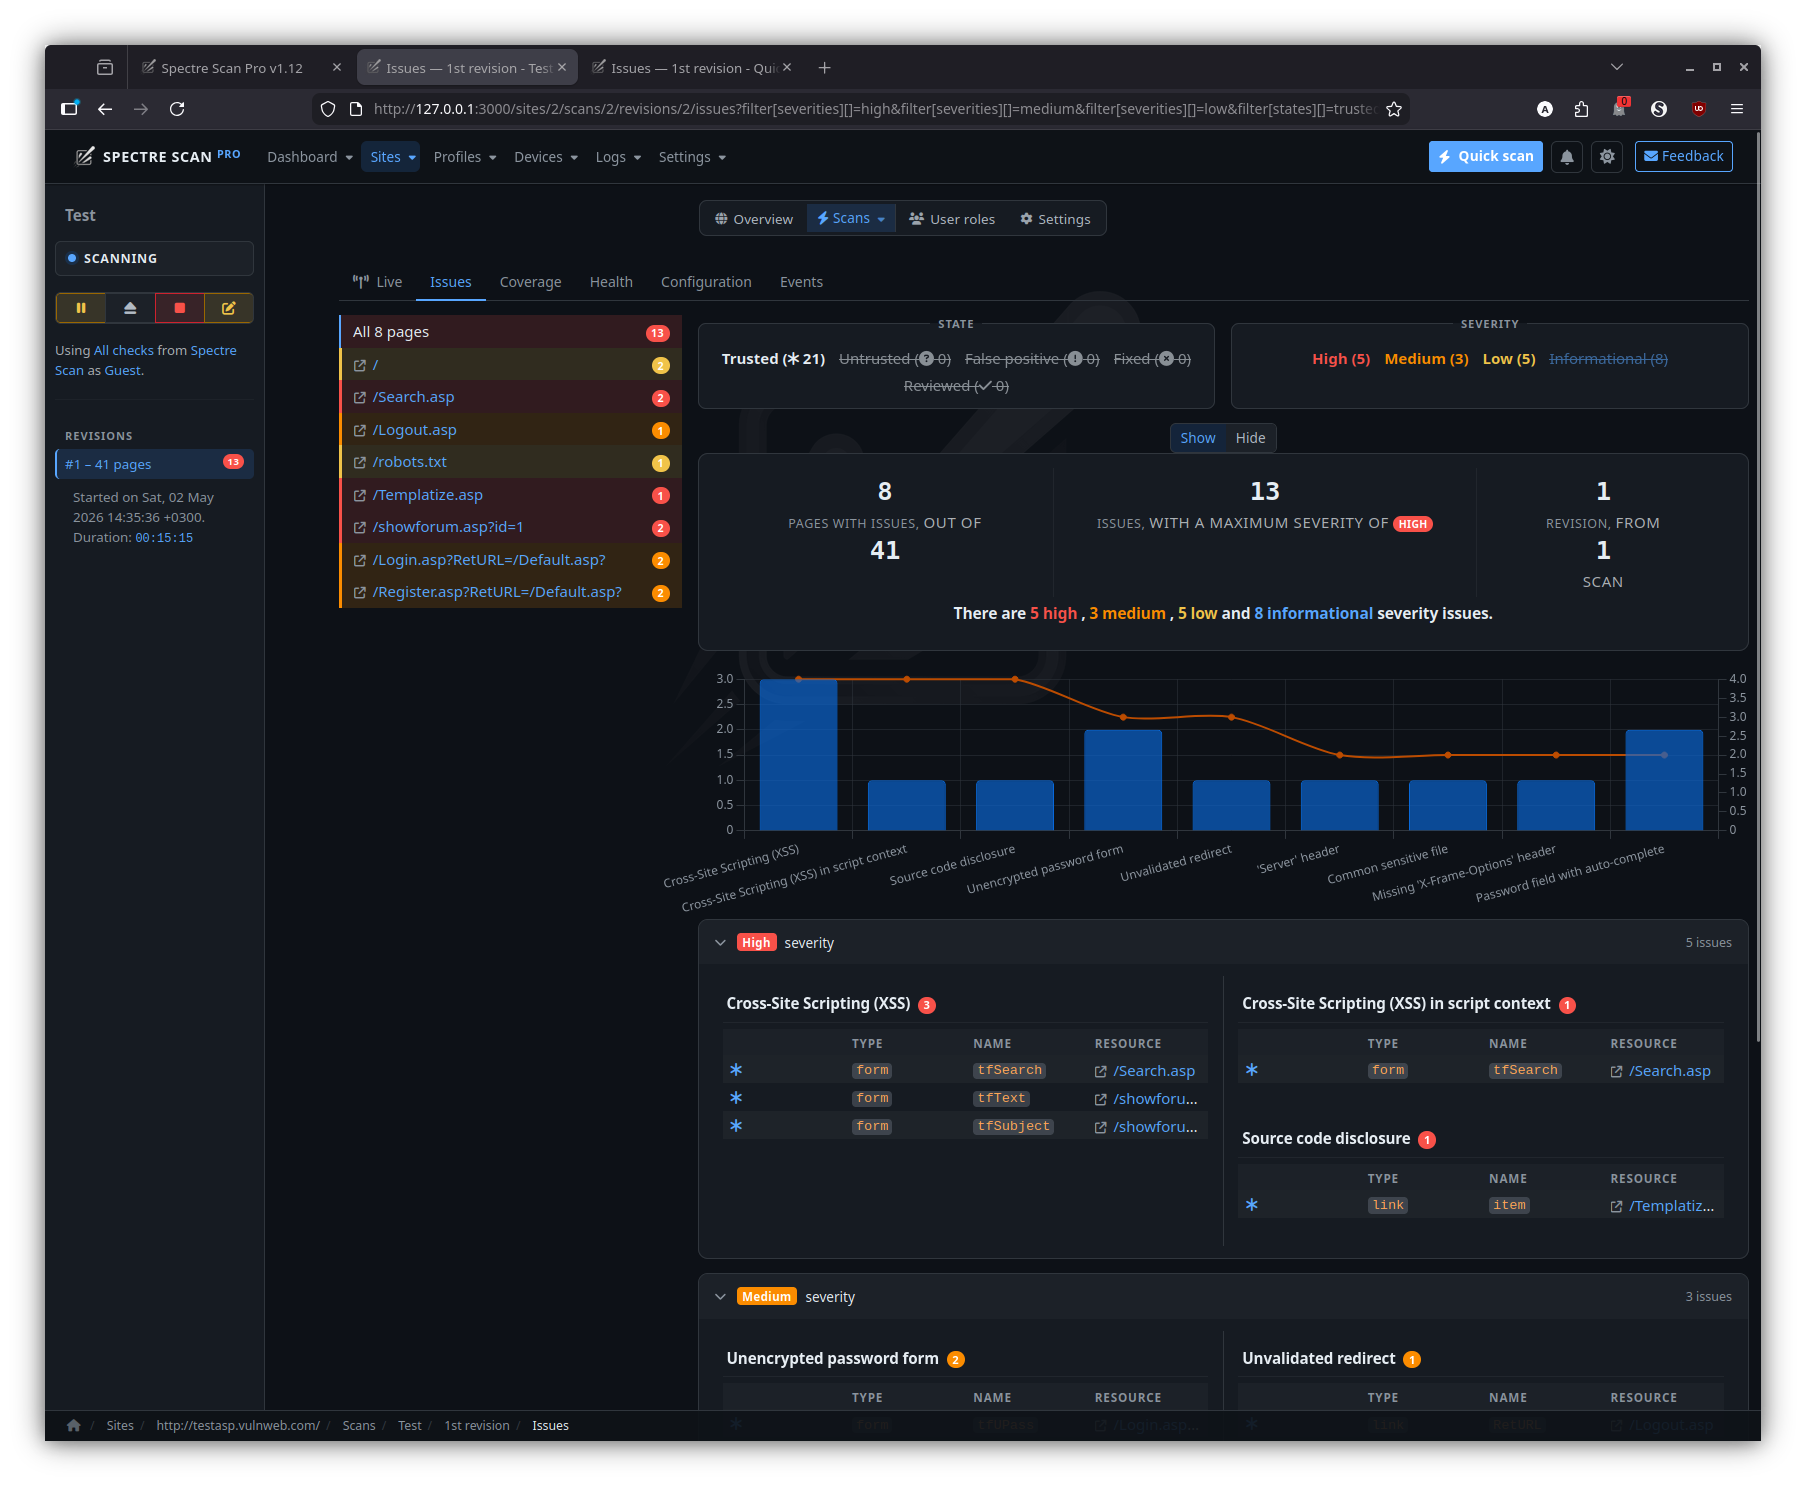
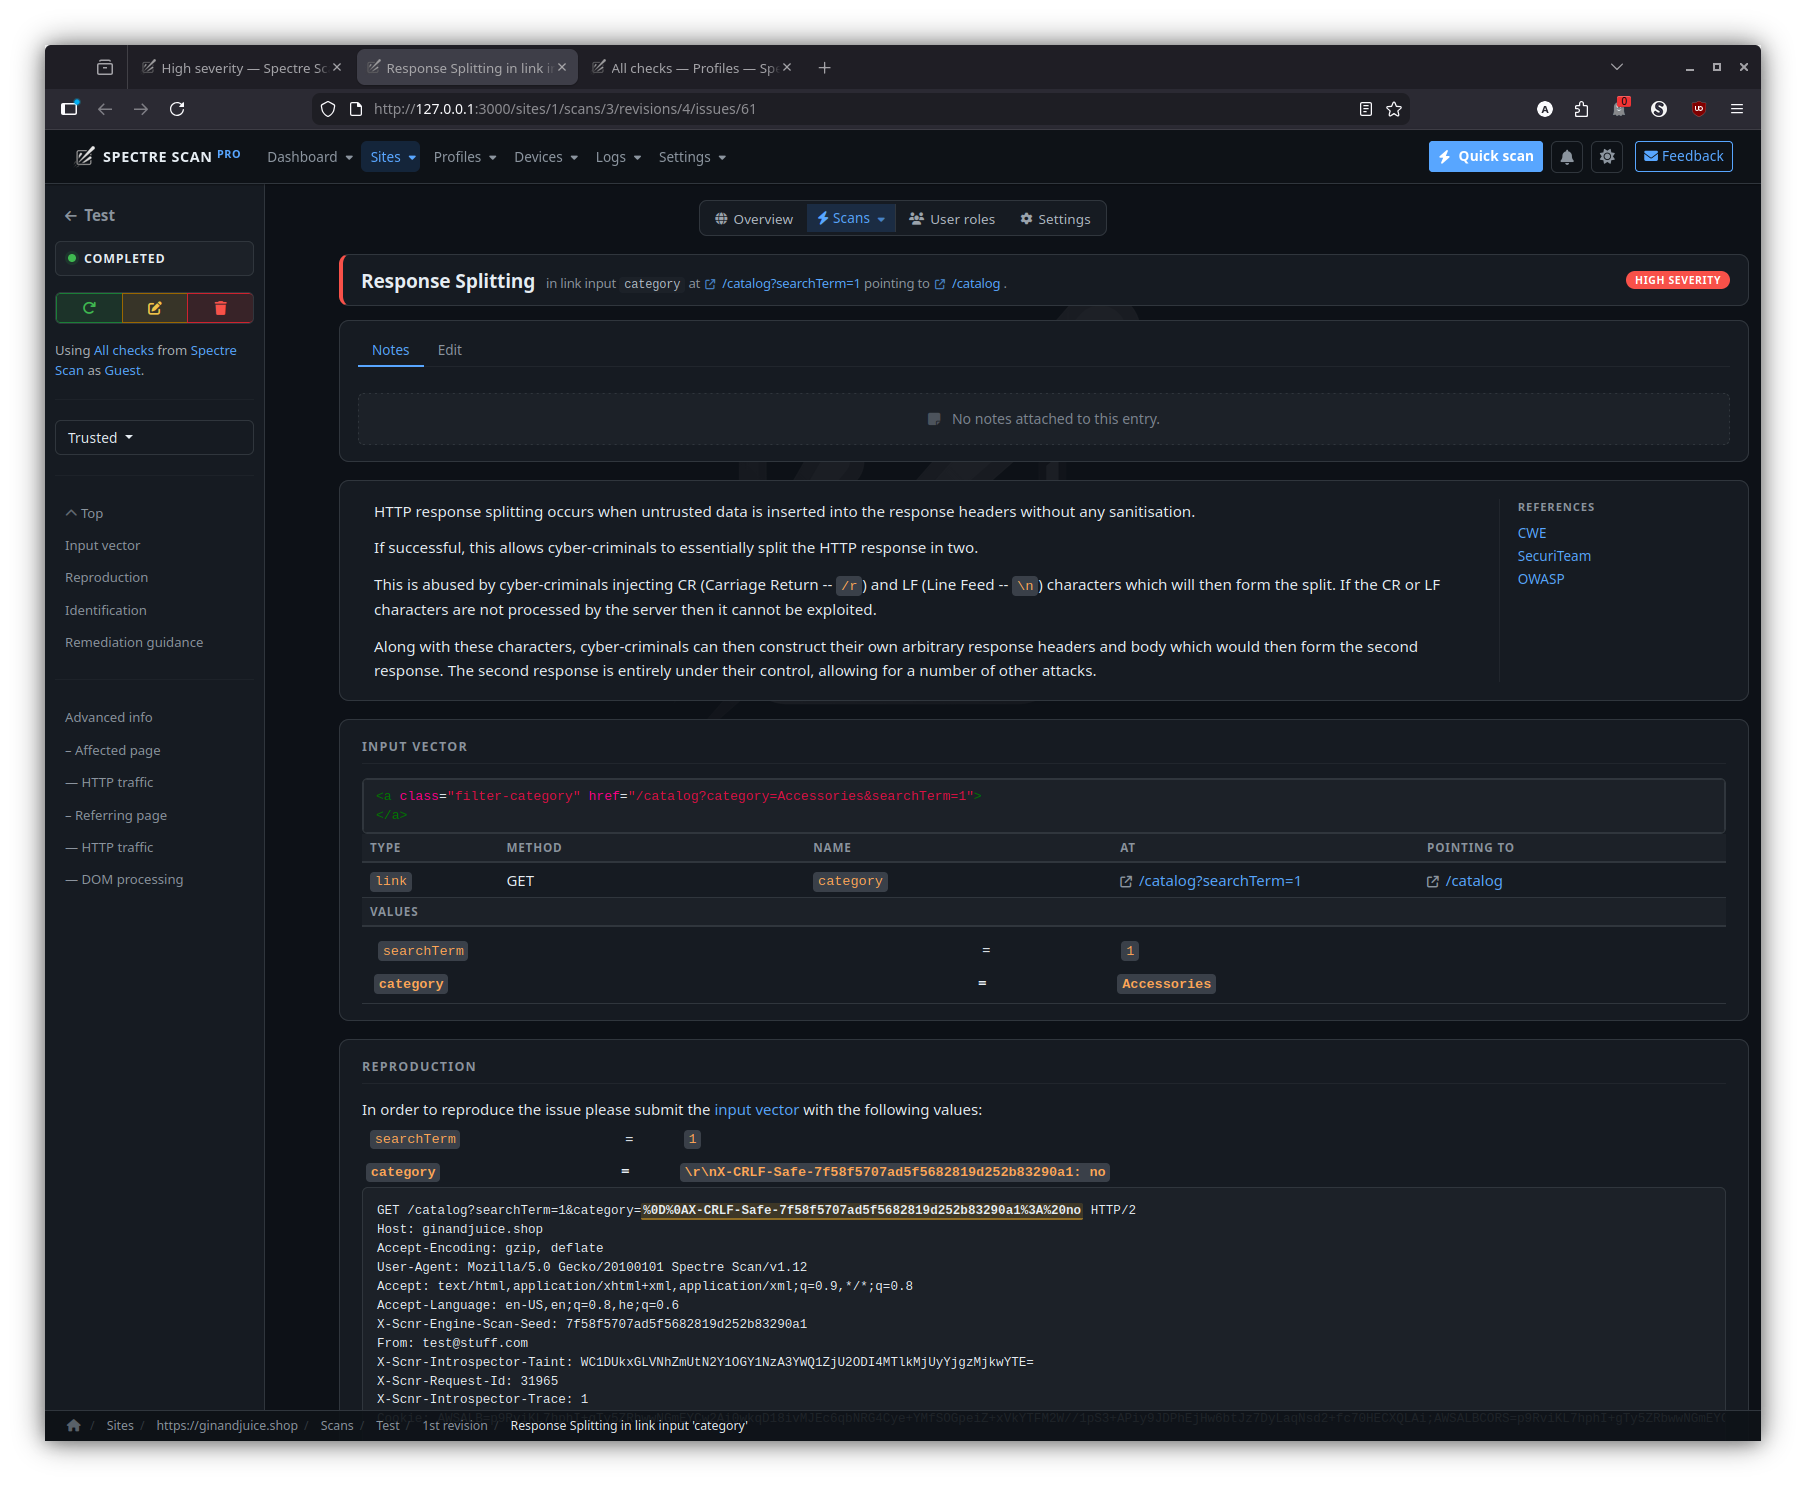
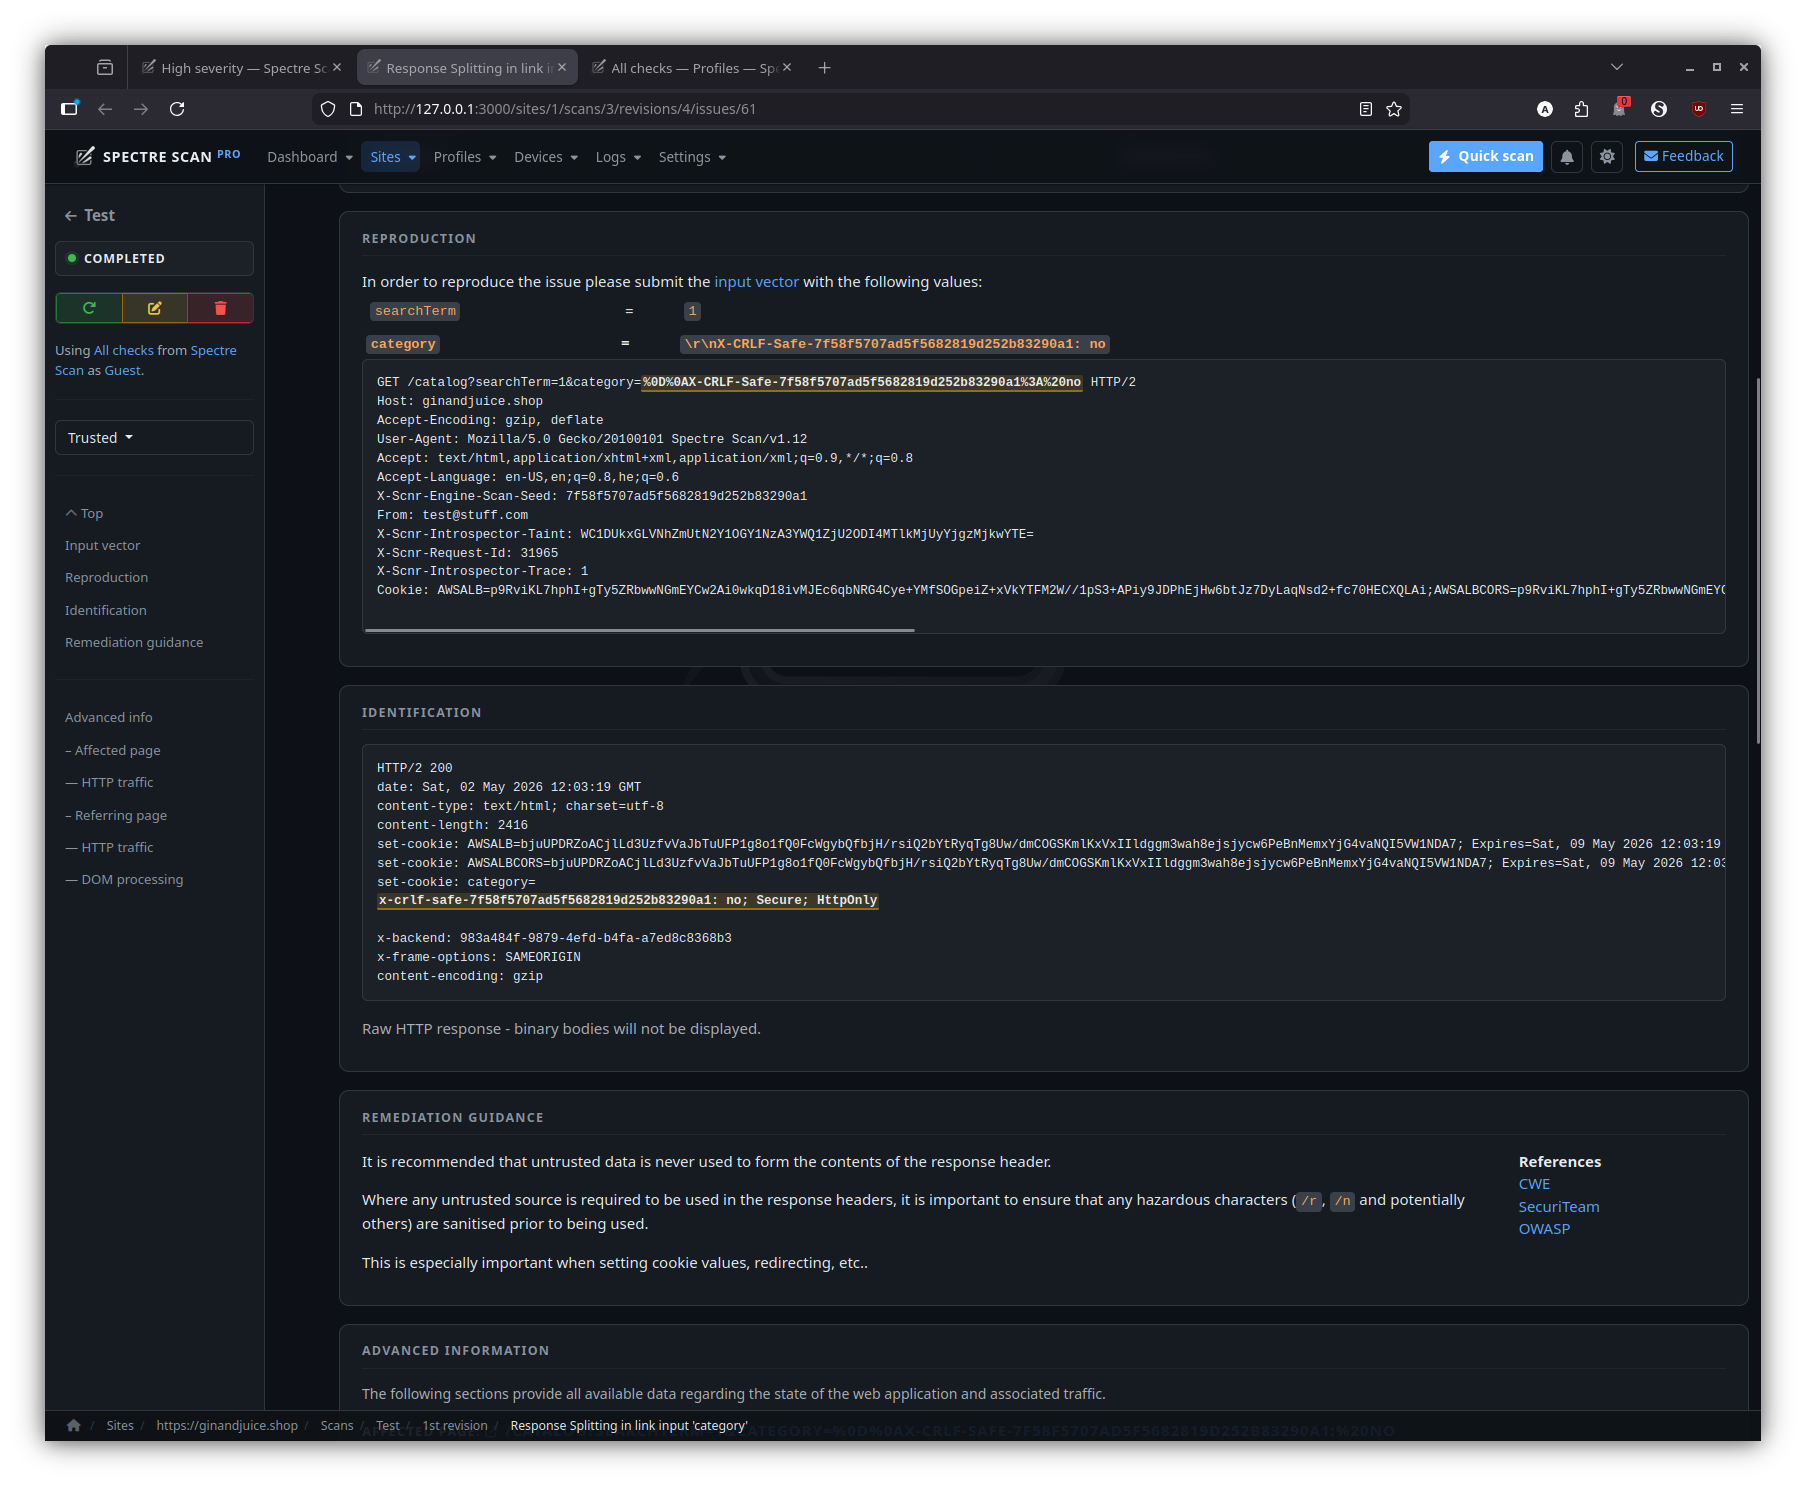
Issues
Drill into individual findings — proof, remediation guidance, exploit, request/response capture, dissected payloads.
Issue detail
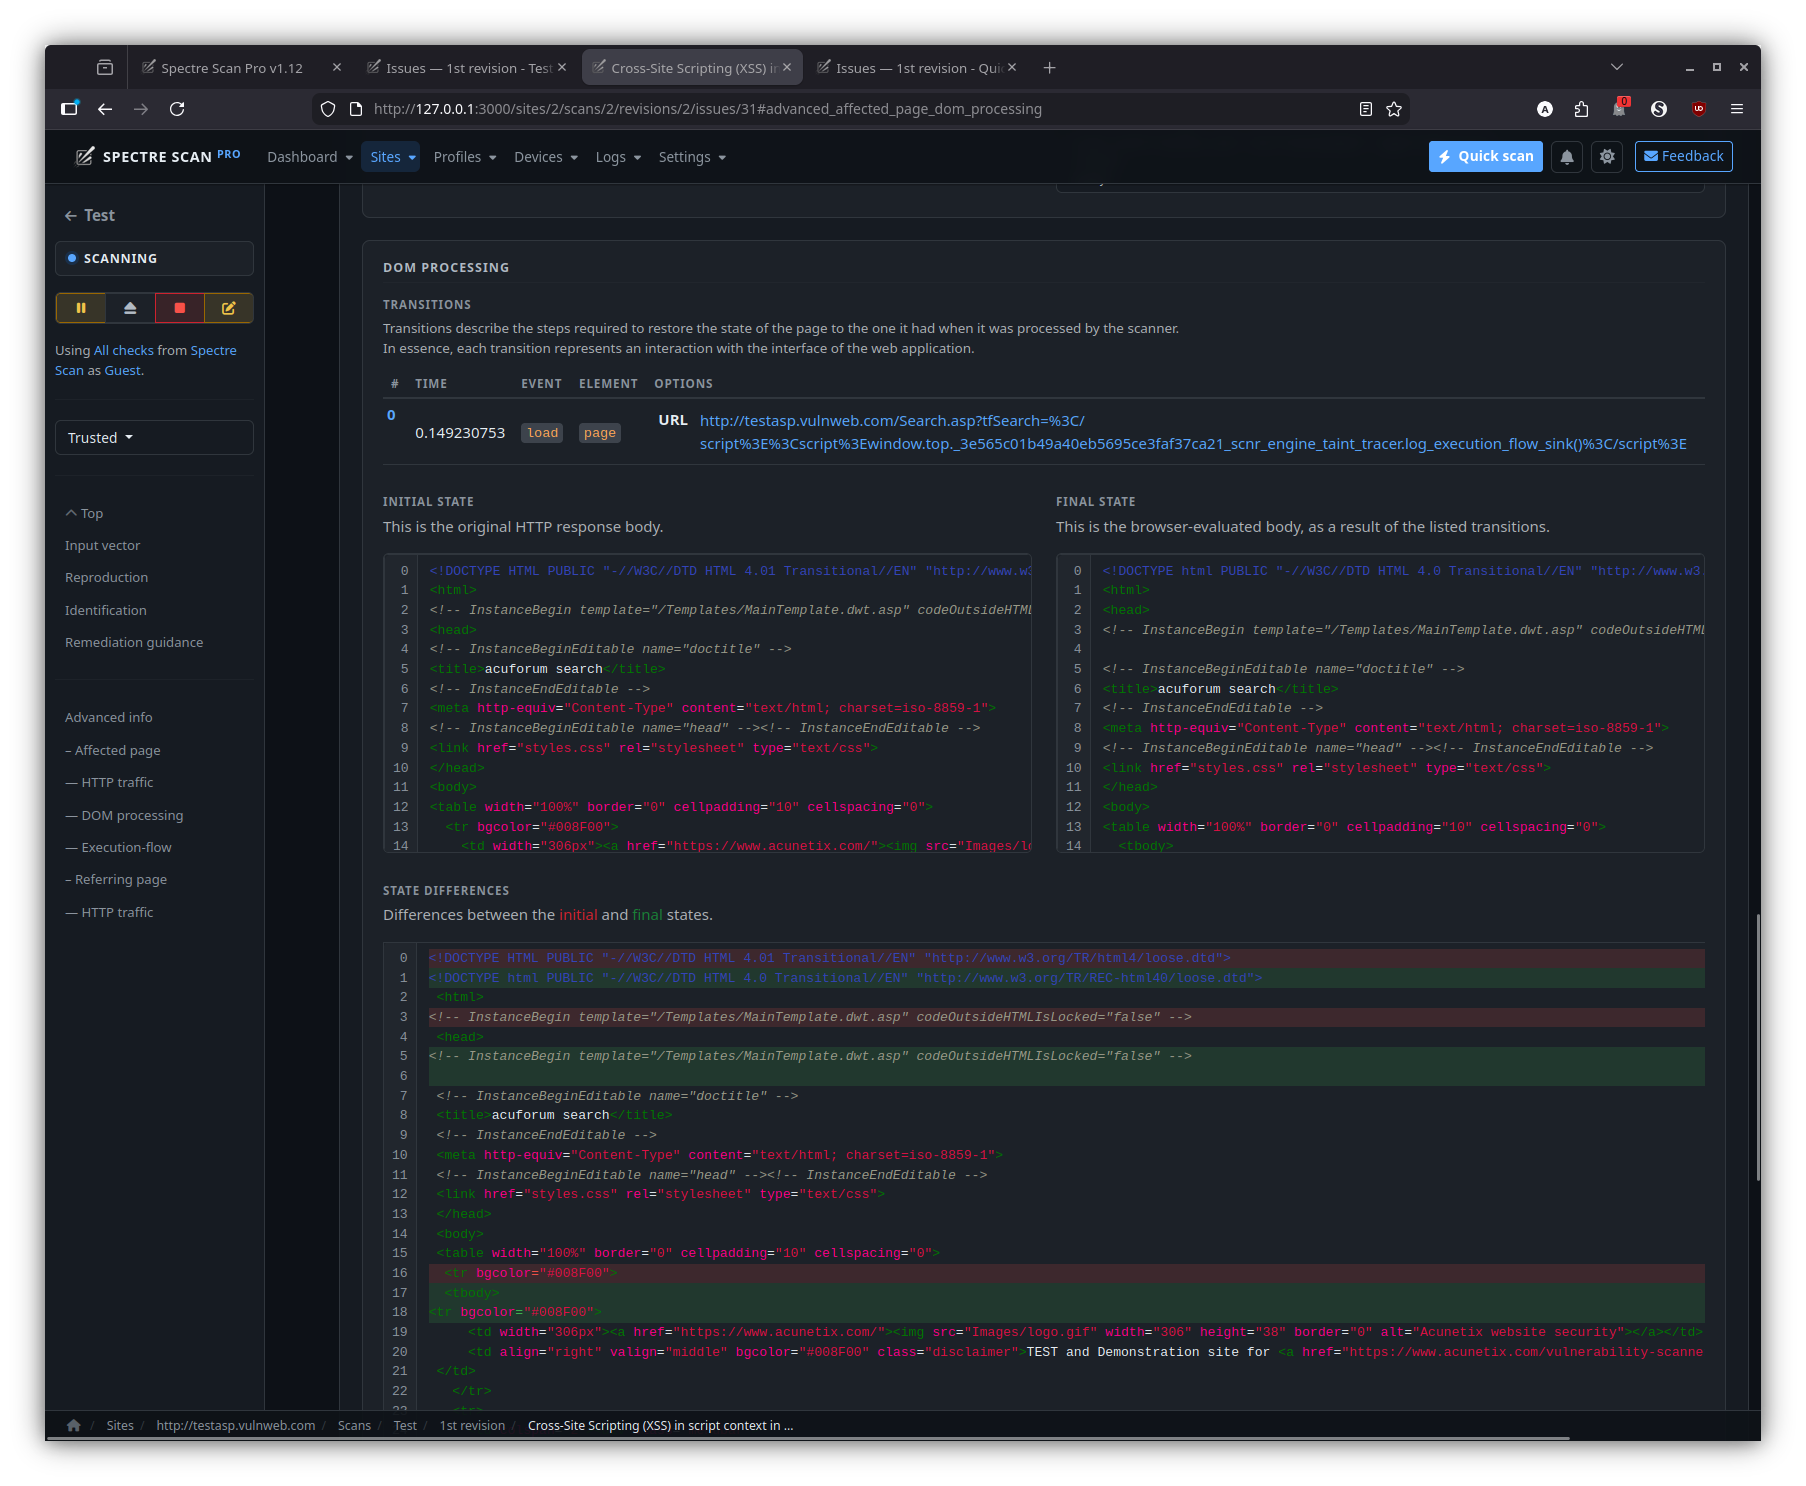
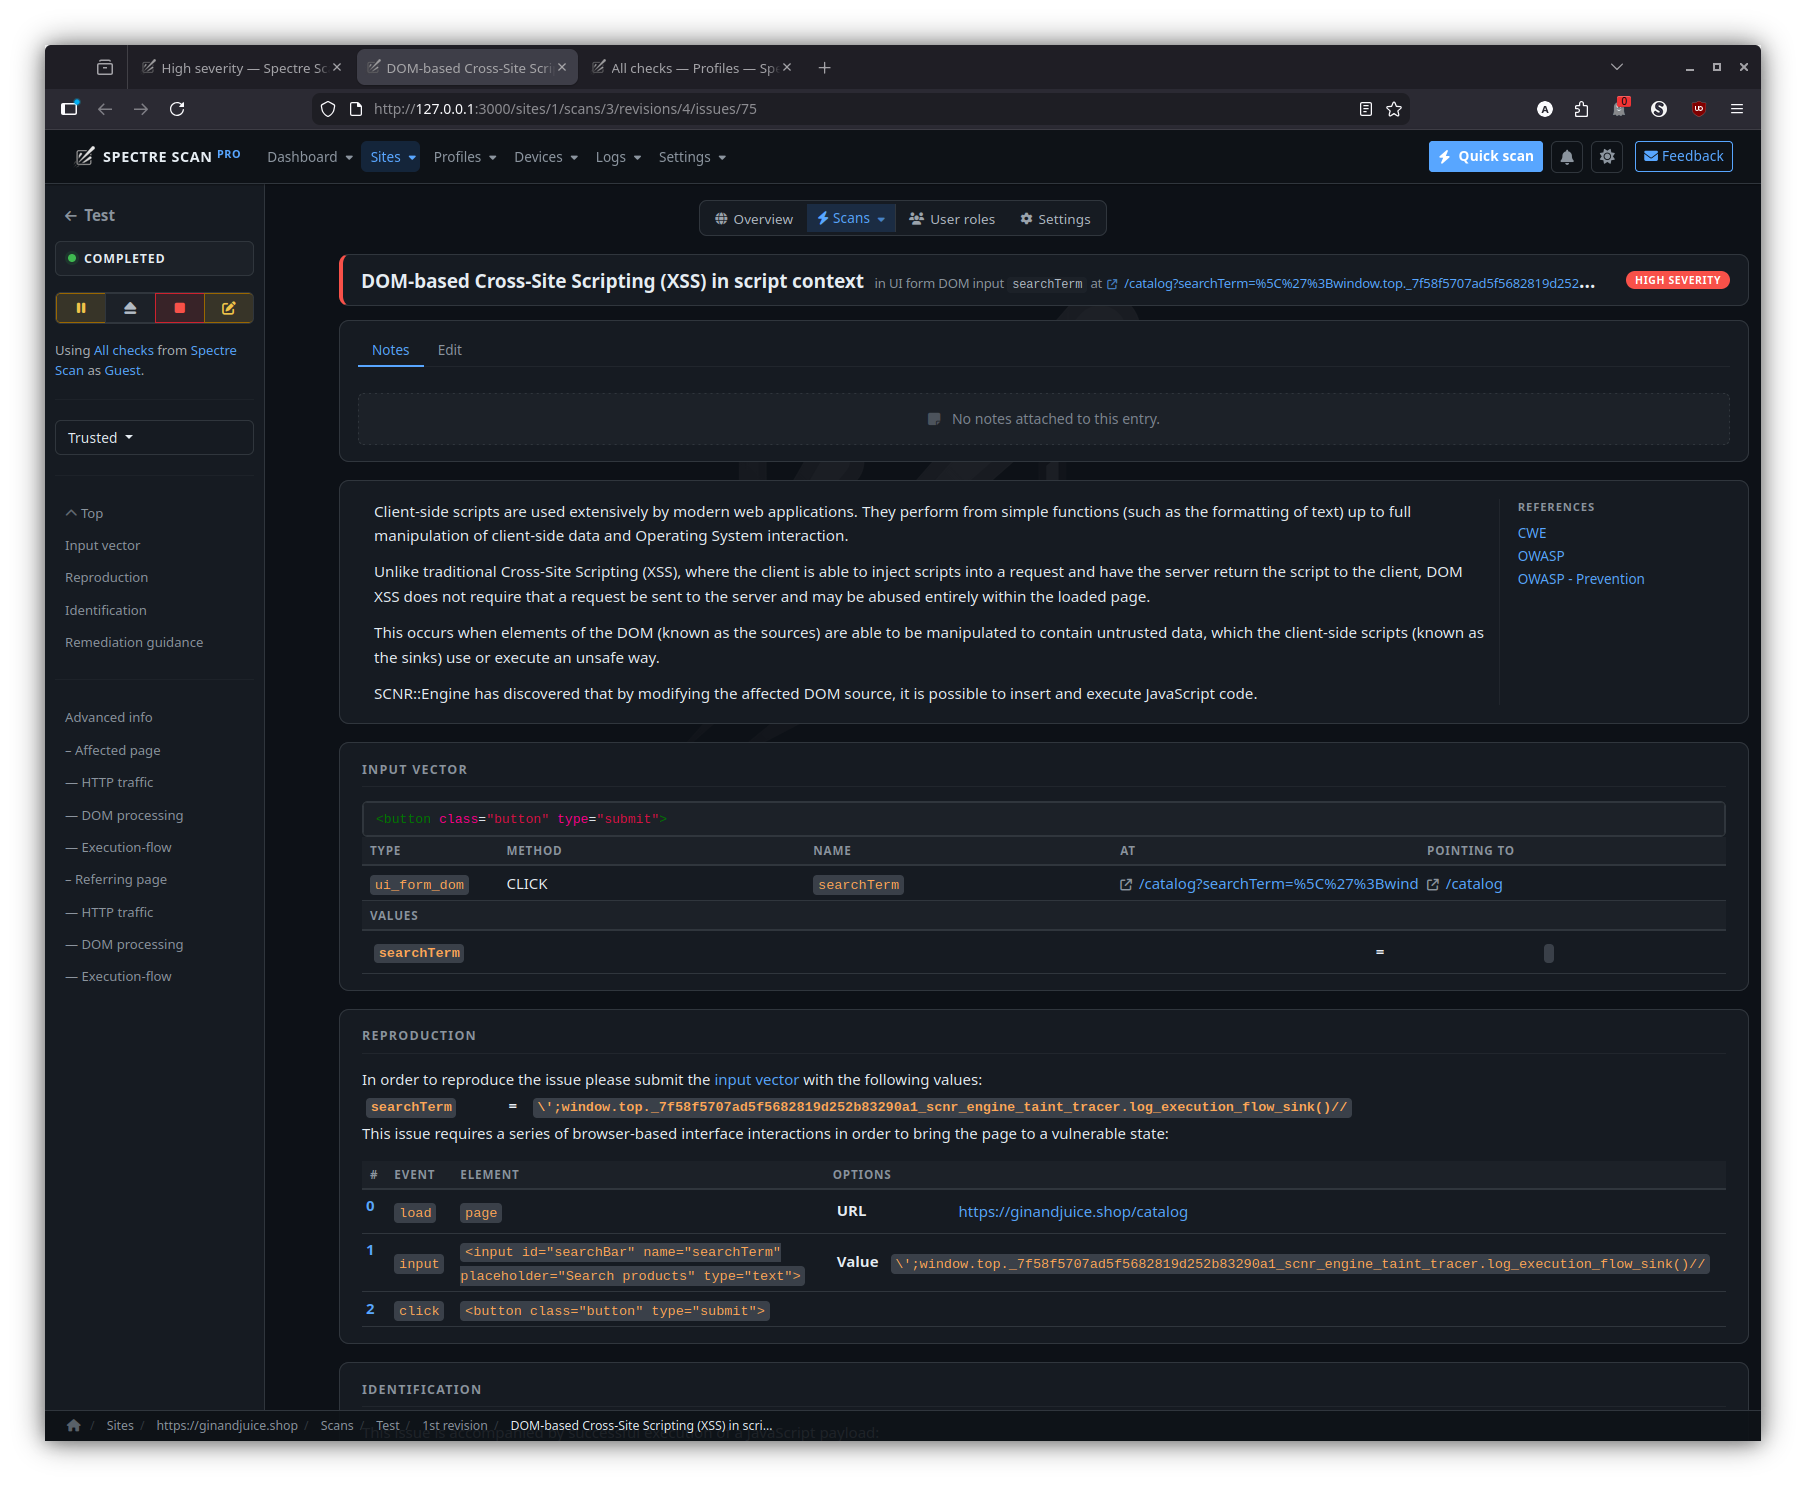
DOM XSS
DOM-XSS issue with the introspector view that traces the data flow from source to sink across the rendered page.
Recurring scans — regressions & fixes
Recurring scans automatically diff their findings across revisions: fixed issues drop out, regressions get flagged, new findings get their own state.
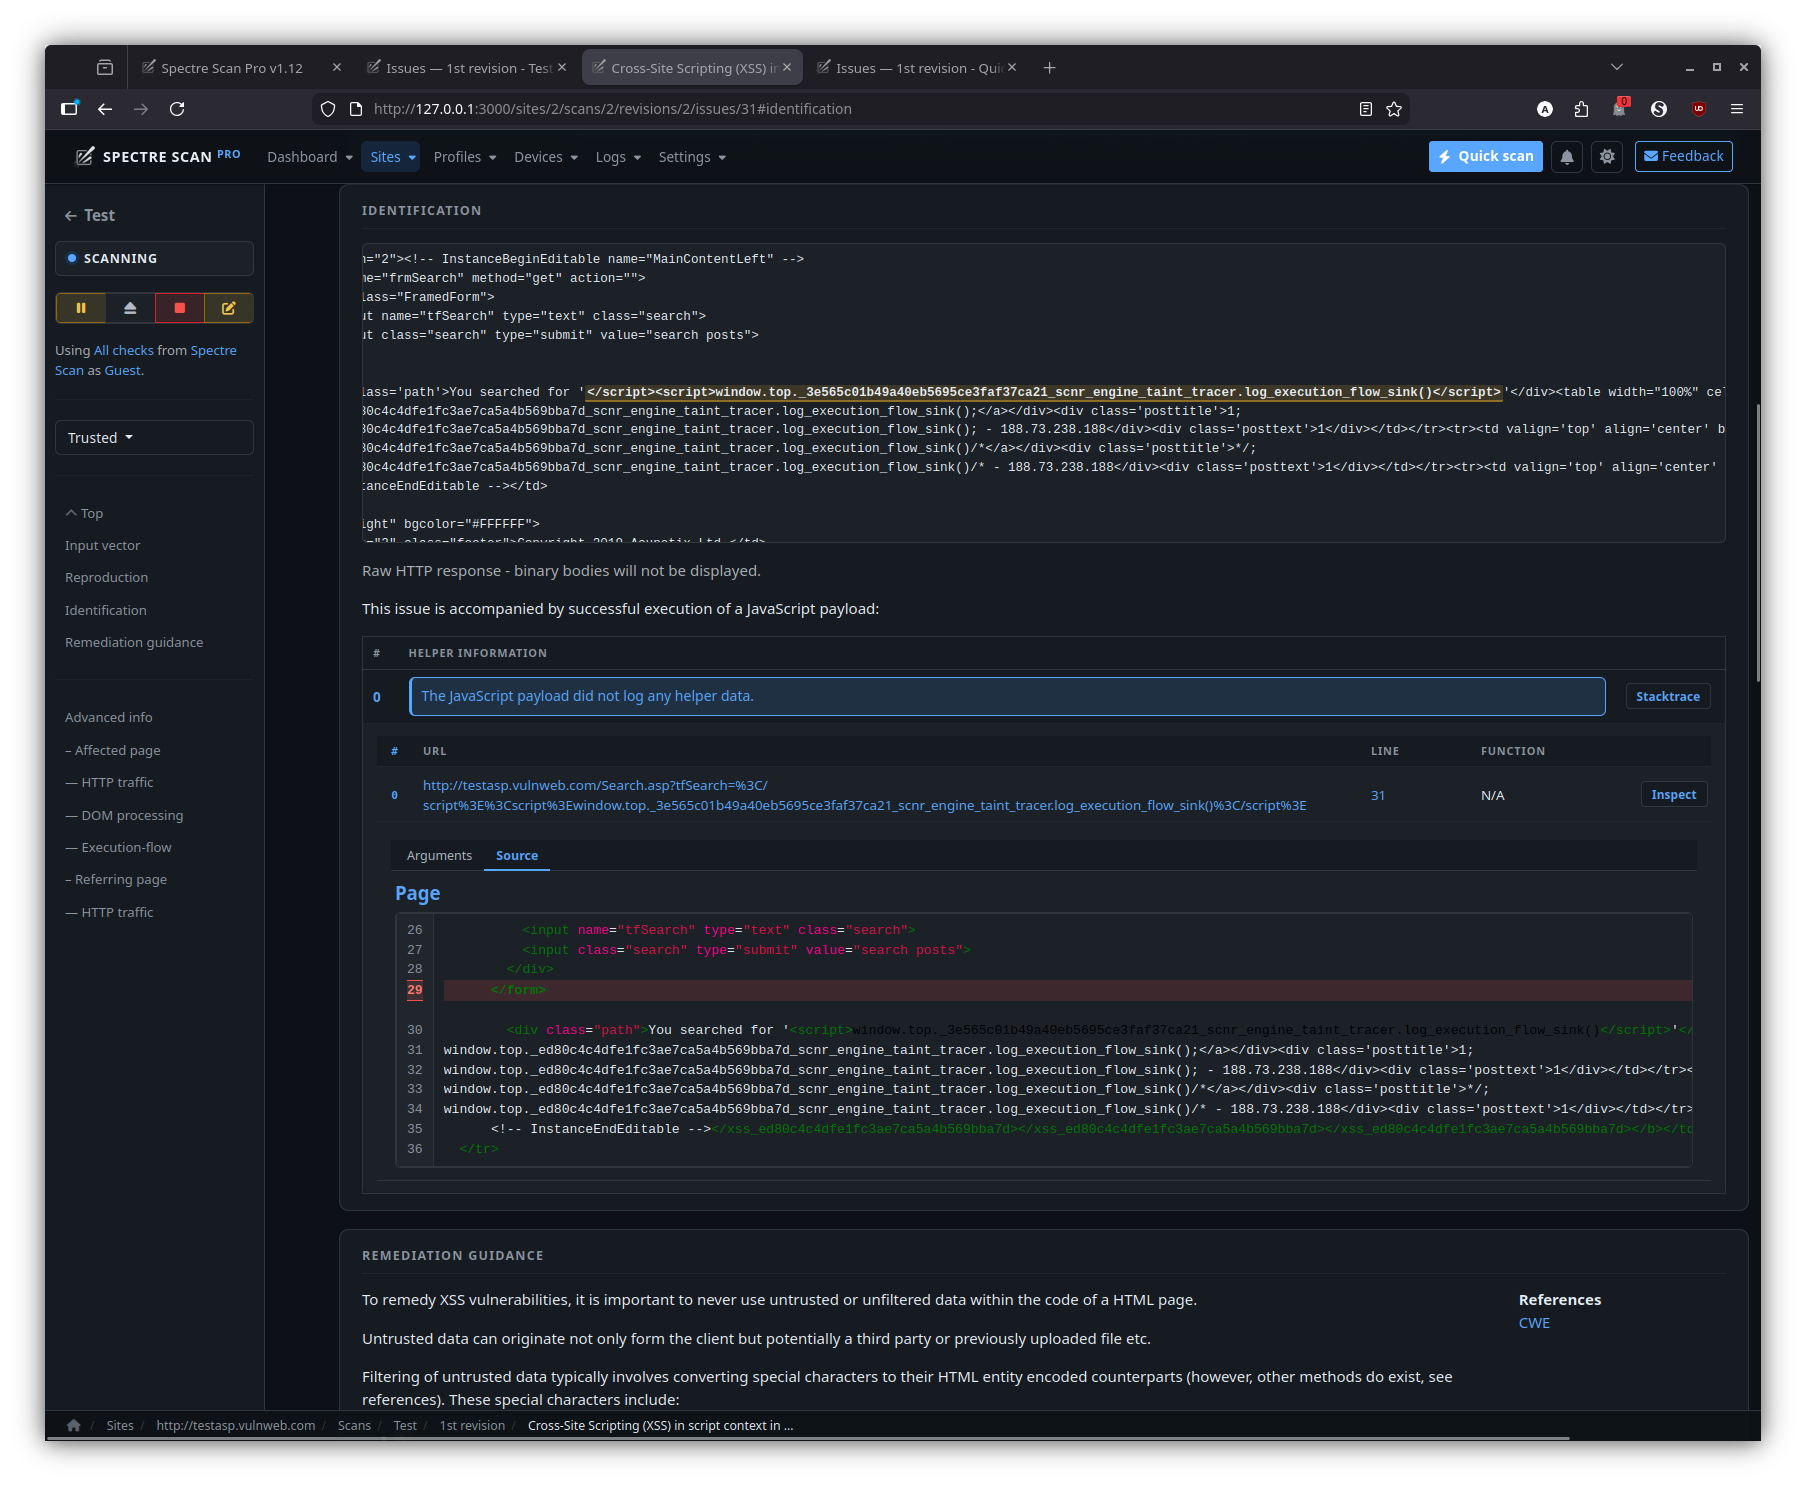
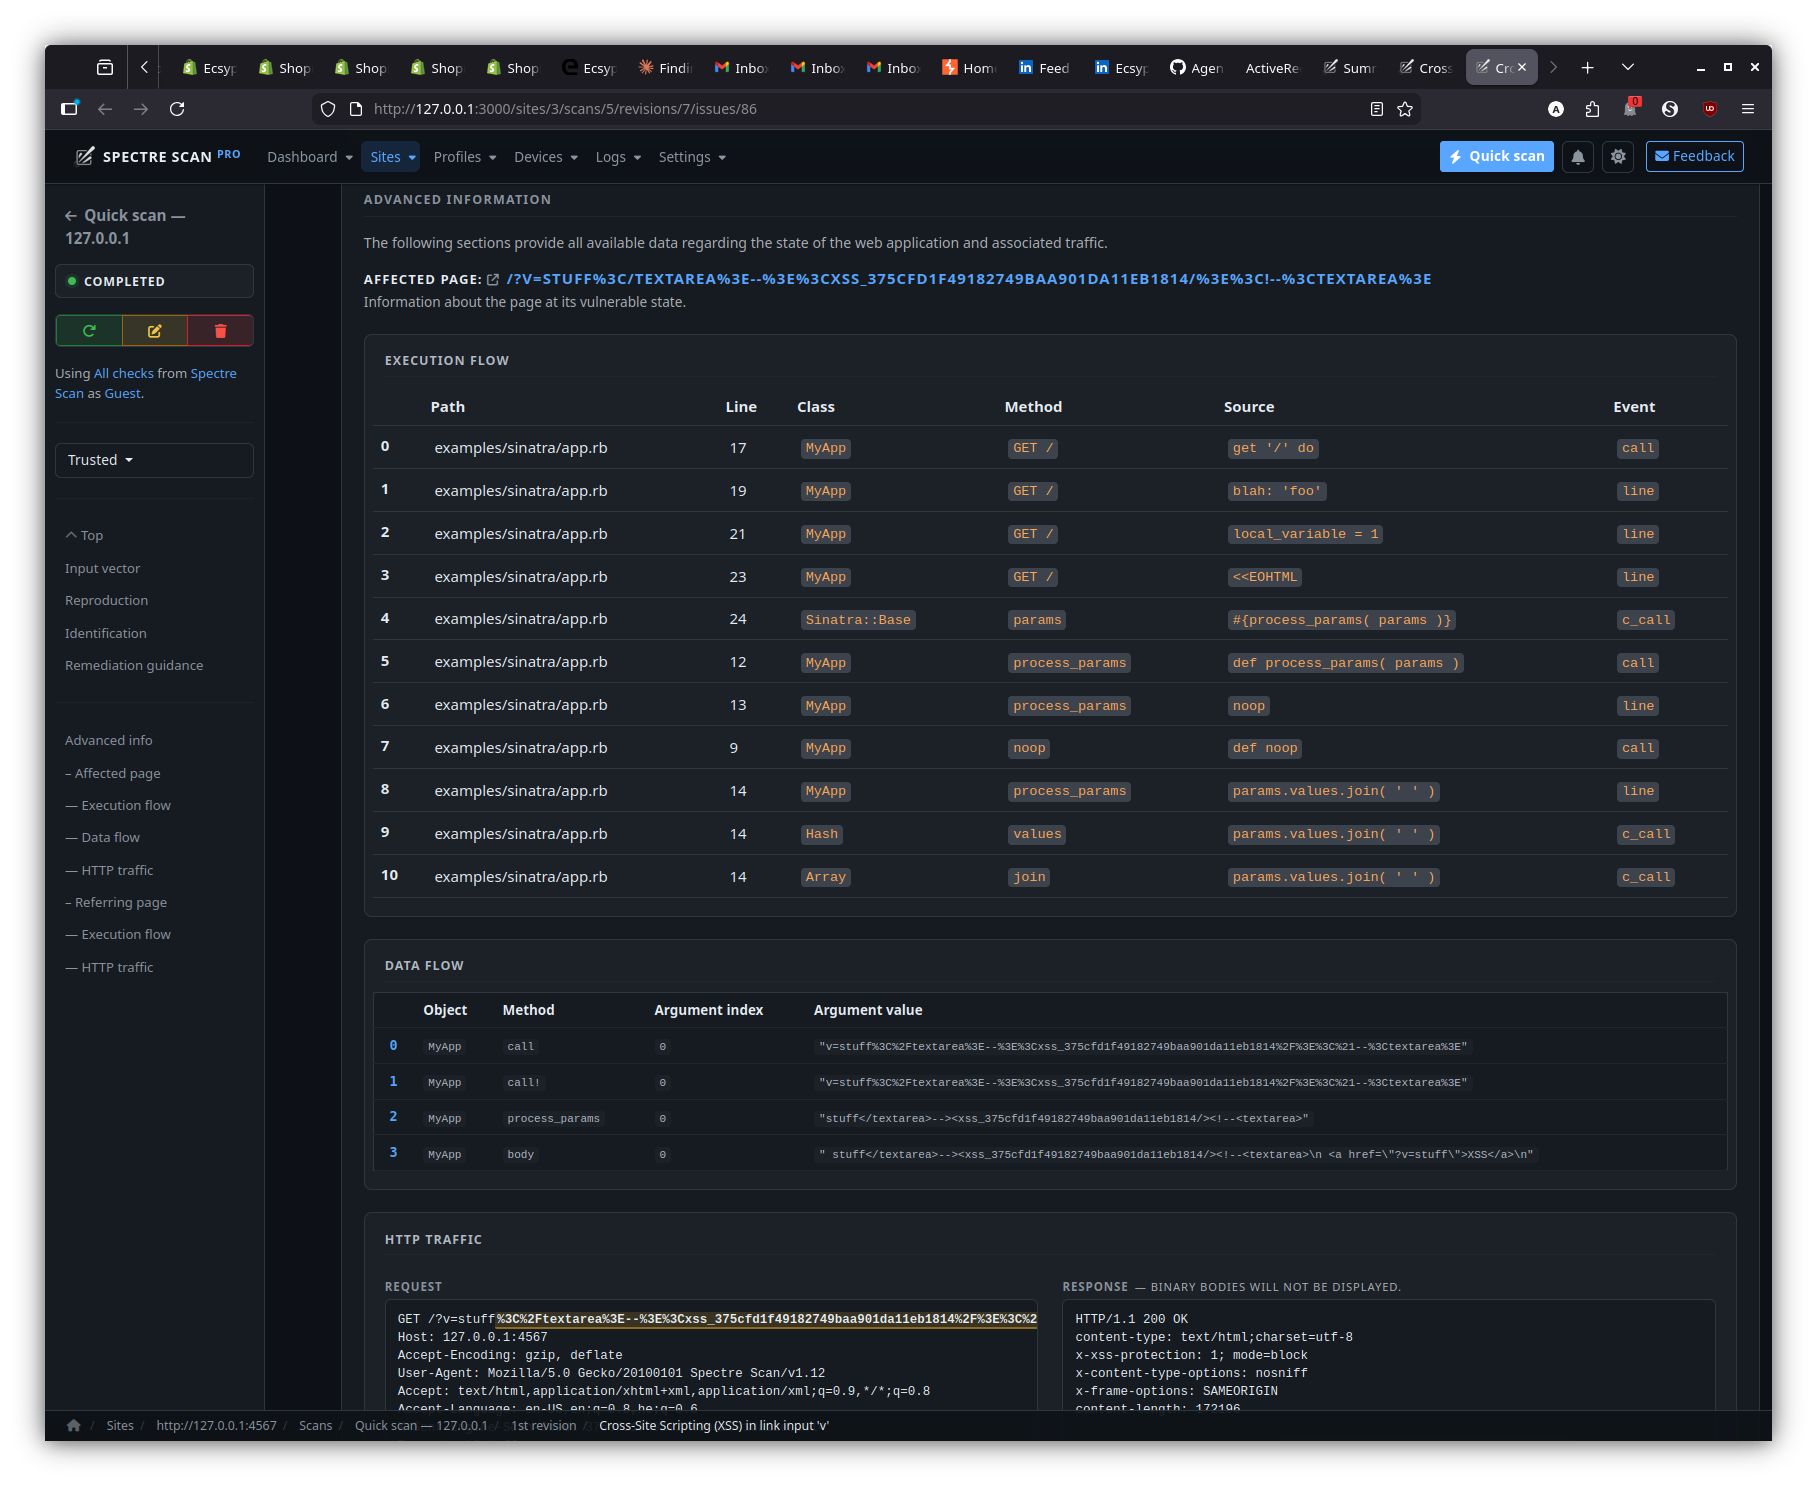
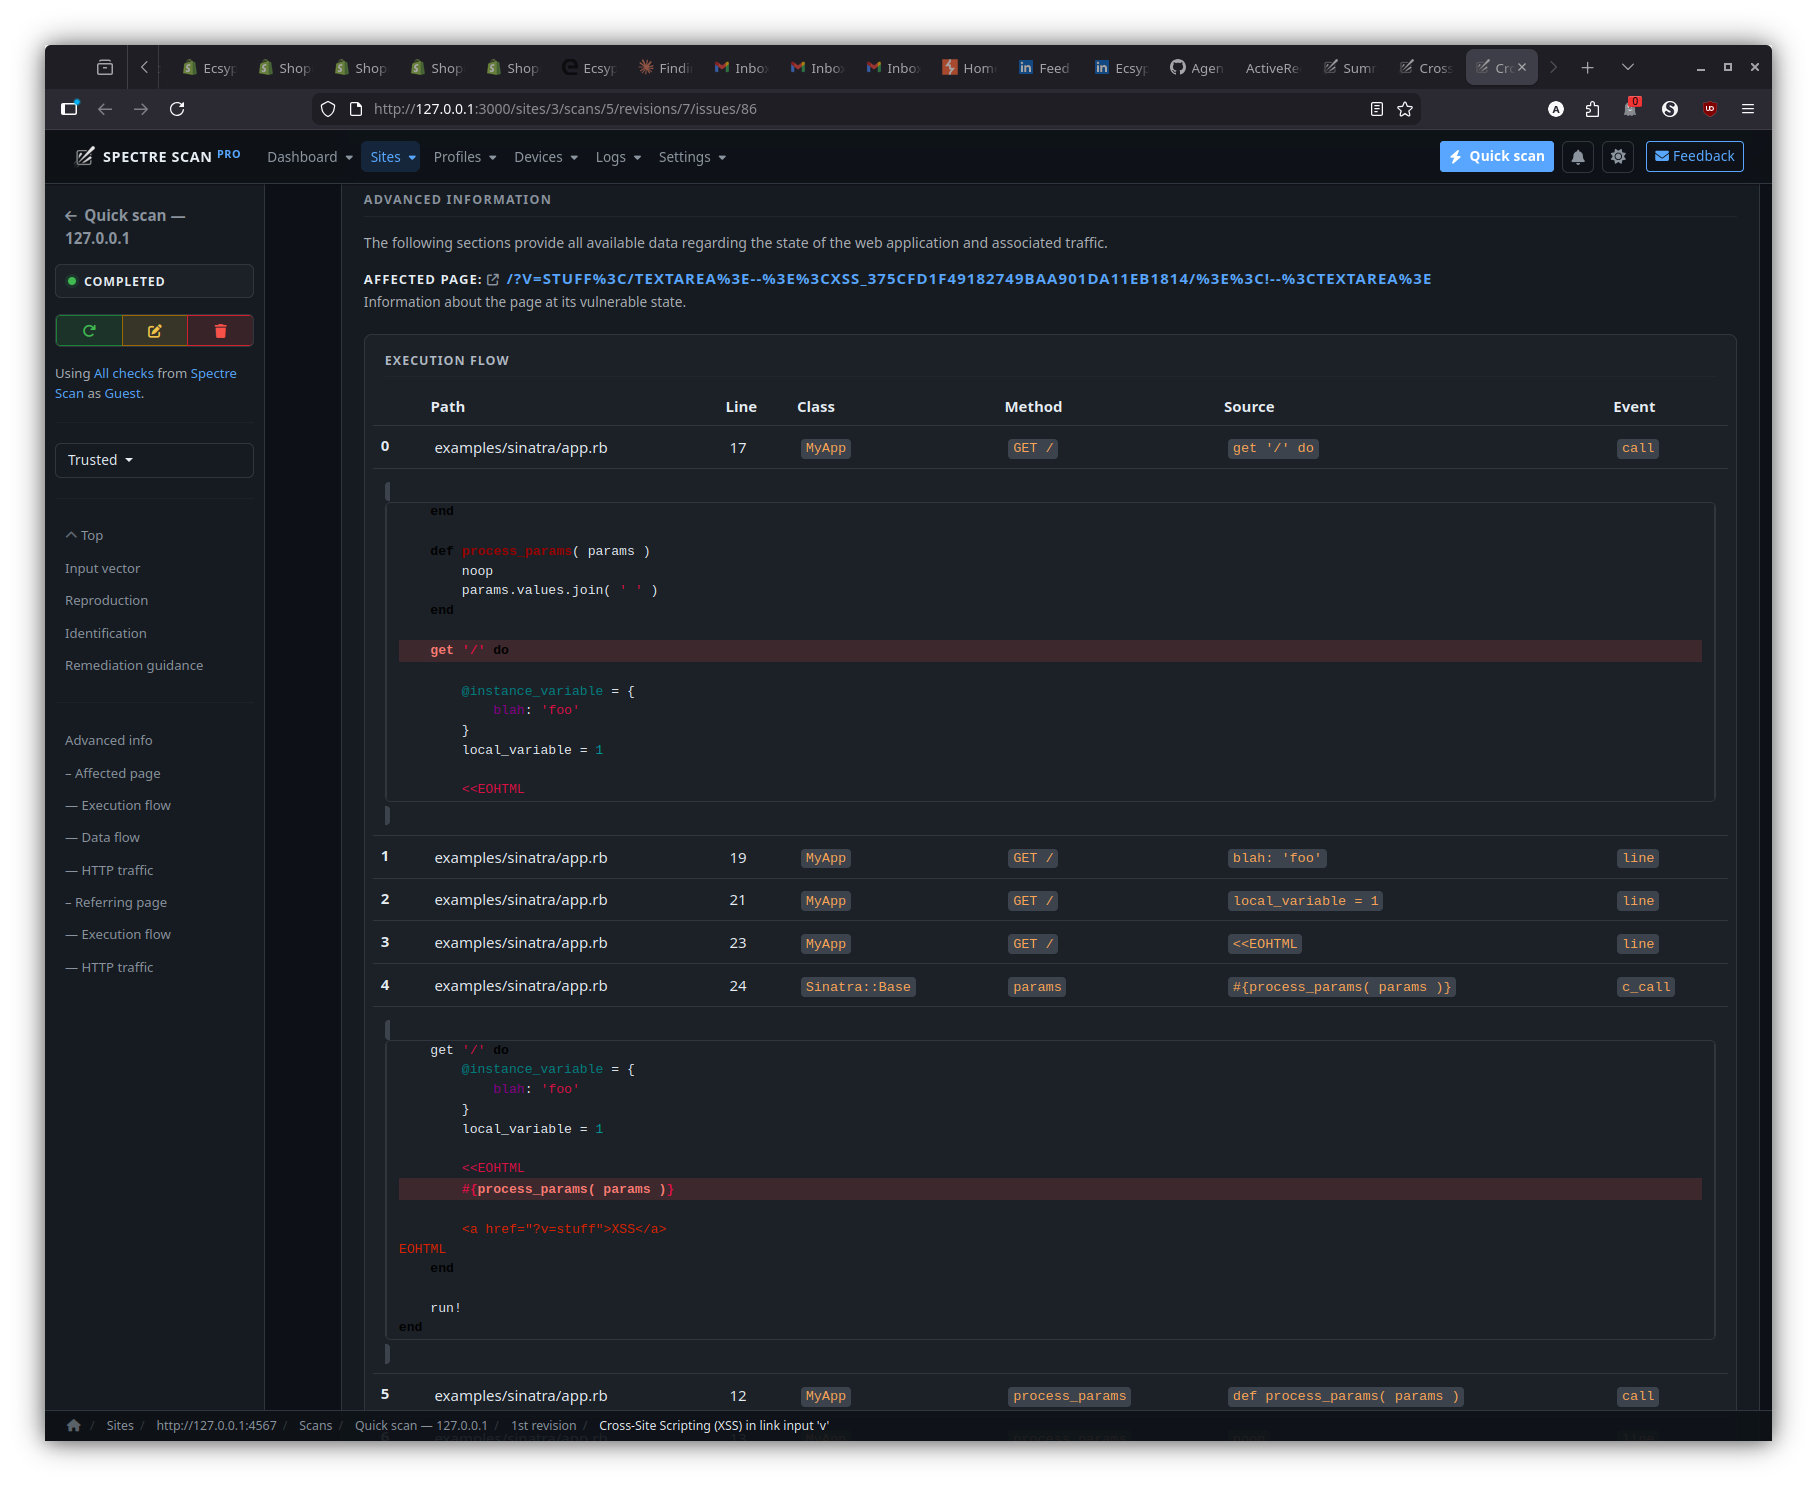
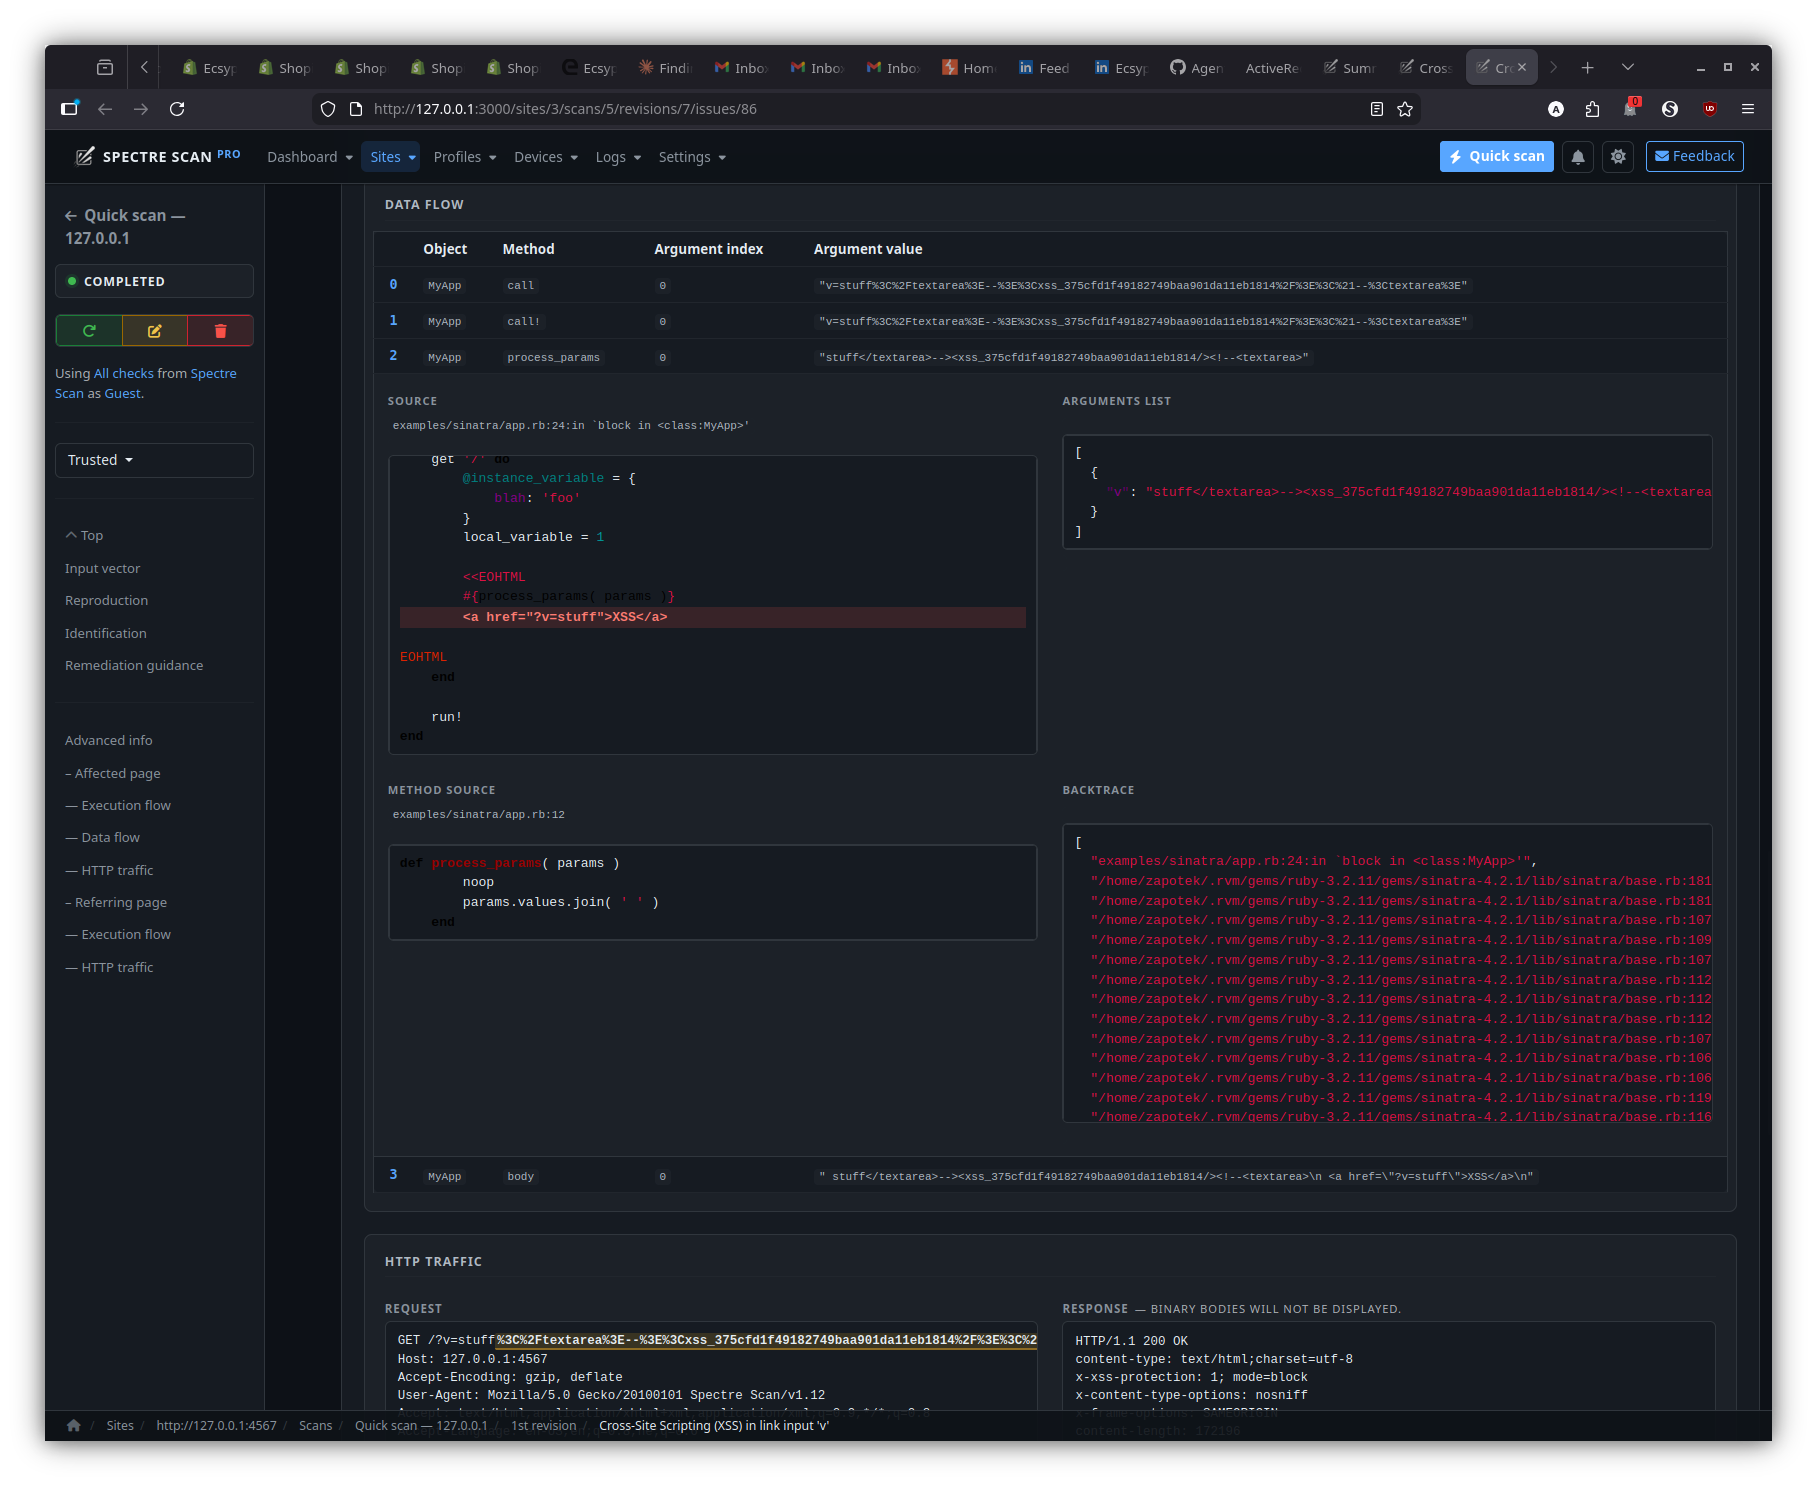
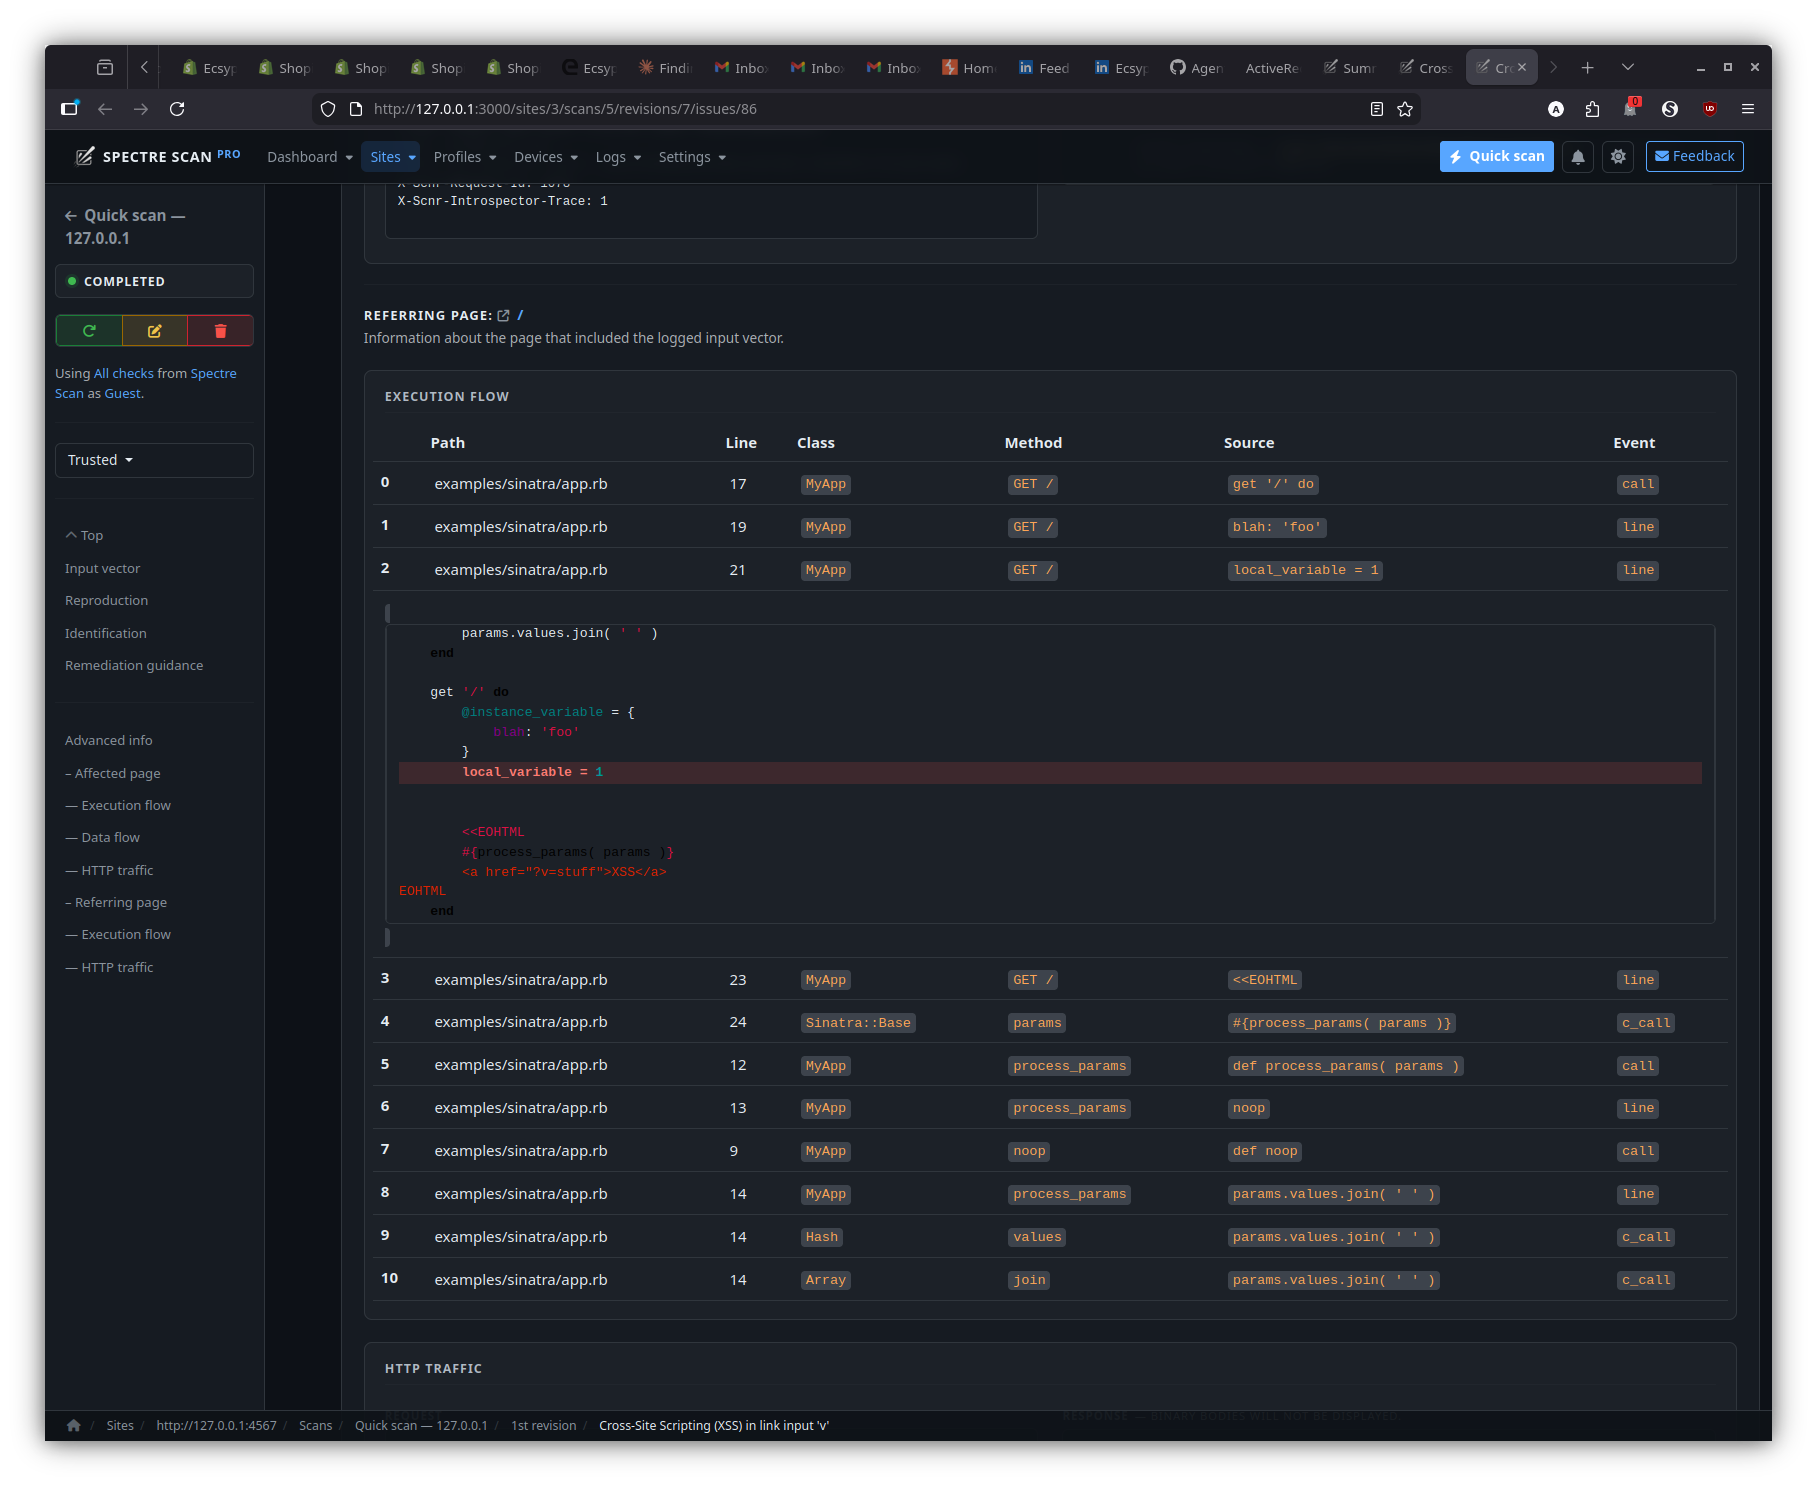
Introspector
A dedicated view for server-side findings: source → sink data-flow trace, captured stack frames and the rendered page snapshot.
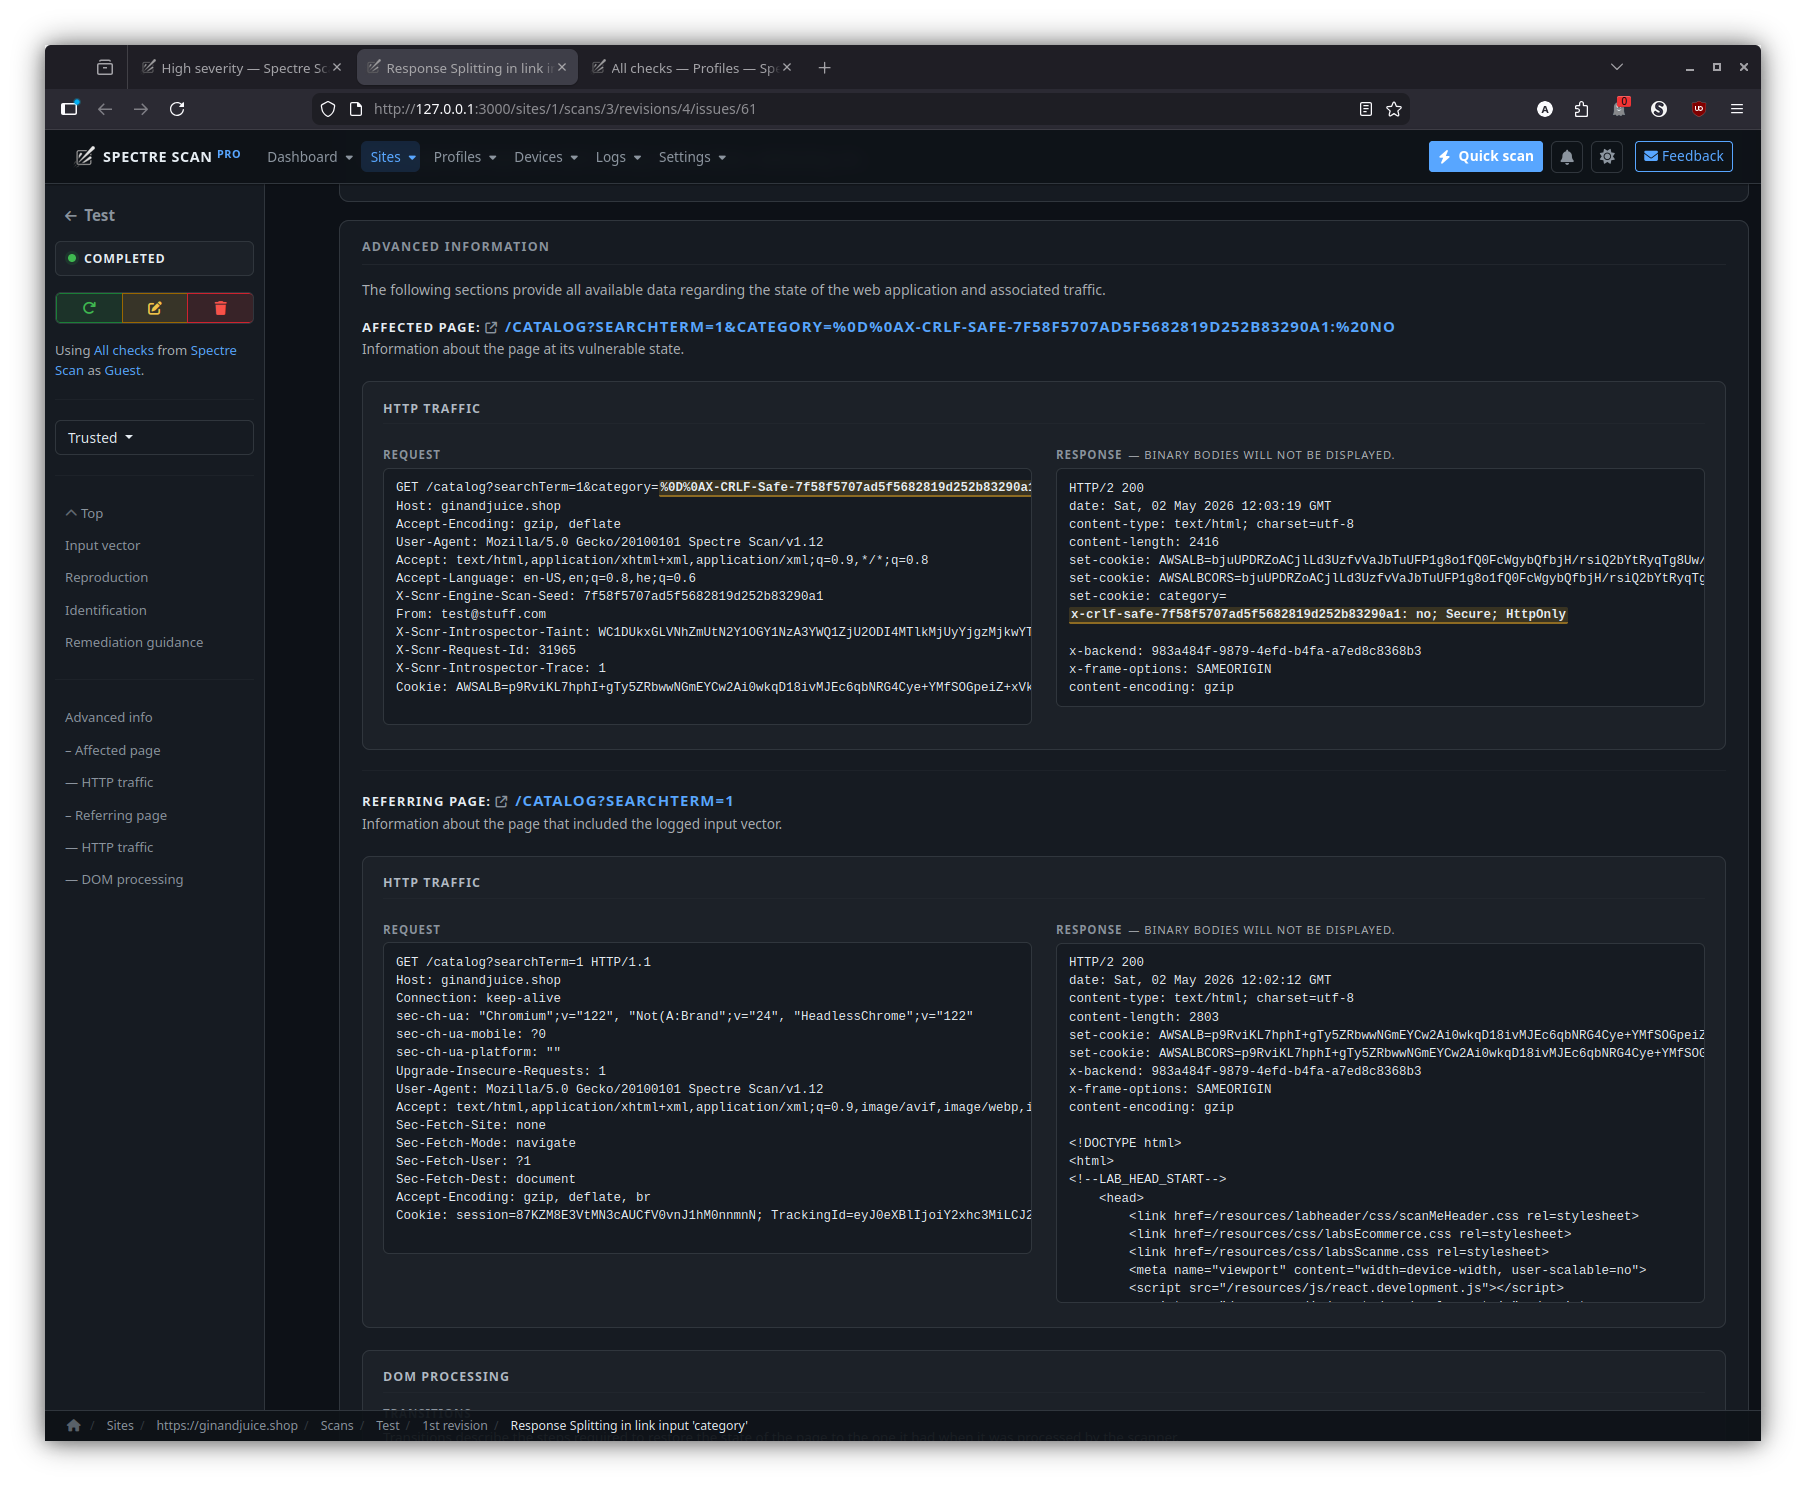
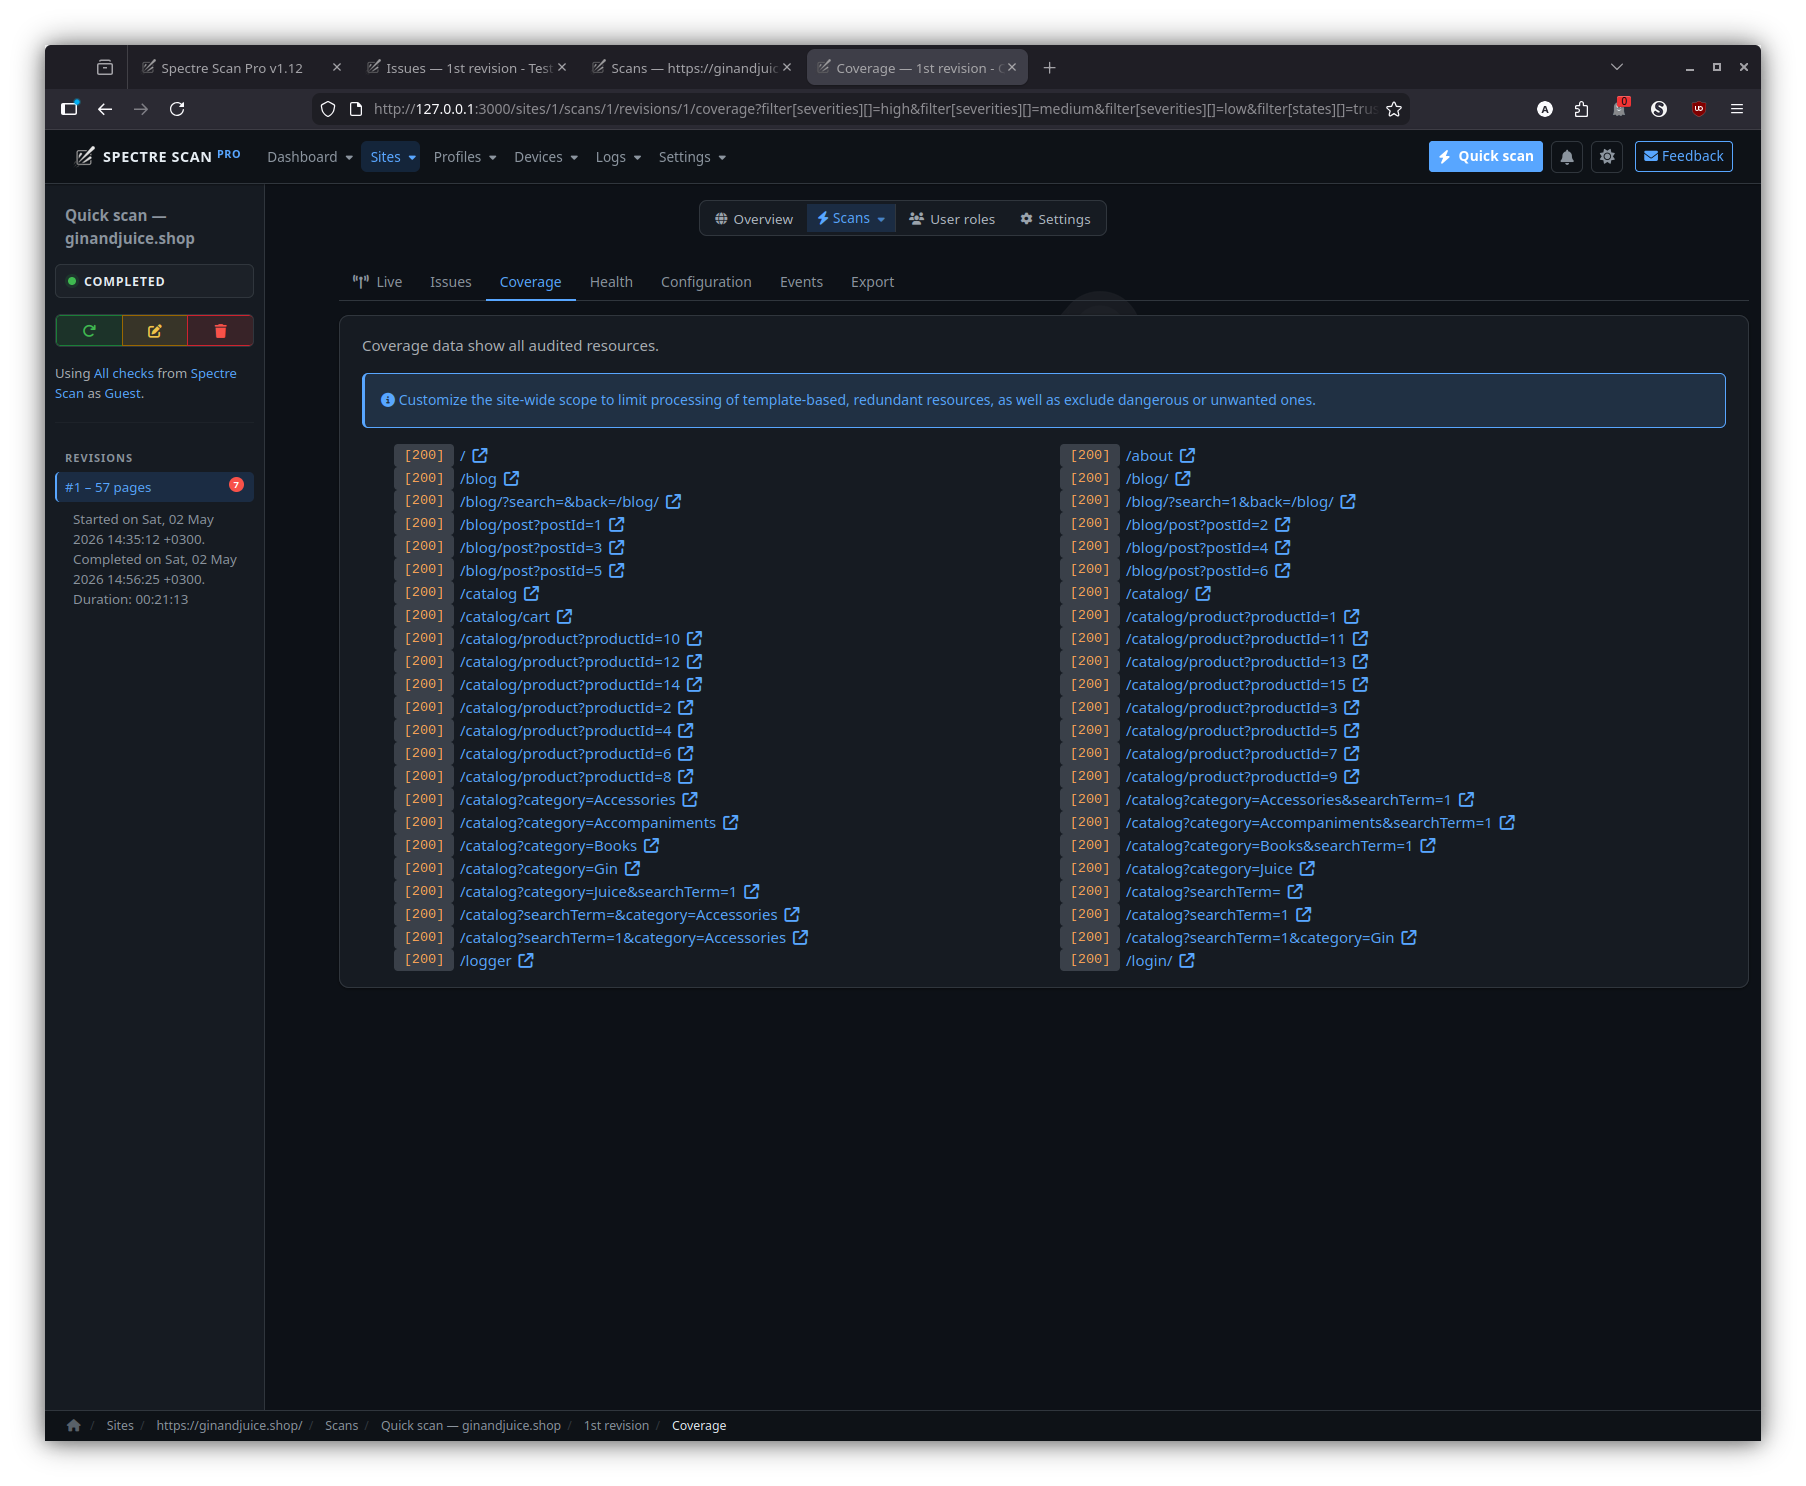
Coverage
Every page the scanner reached, with HTTP status, content-type and a click-through to the issues that came out of each one.
Health
Server / scanner / network health — request rate, response times, browser-pool utilisation, error counts.
Logs
A full audit log of every change to sites, scans, revisions, issues and user roles. Filterable by event, object type and actor.
Profiles
Reusable scan configurations: which checks to run, scope rules, plug-ins, audit options.
All profiles
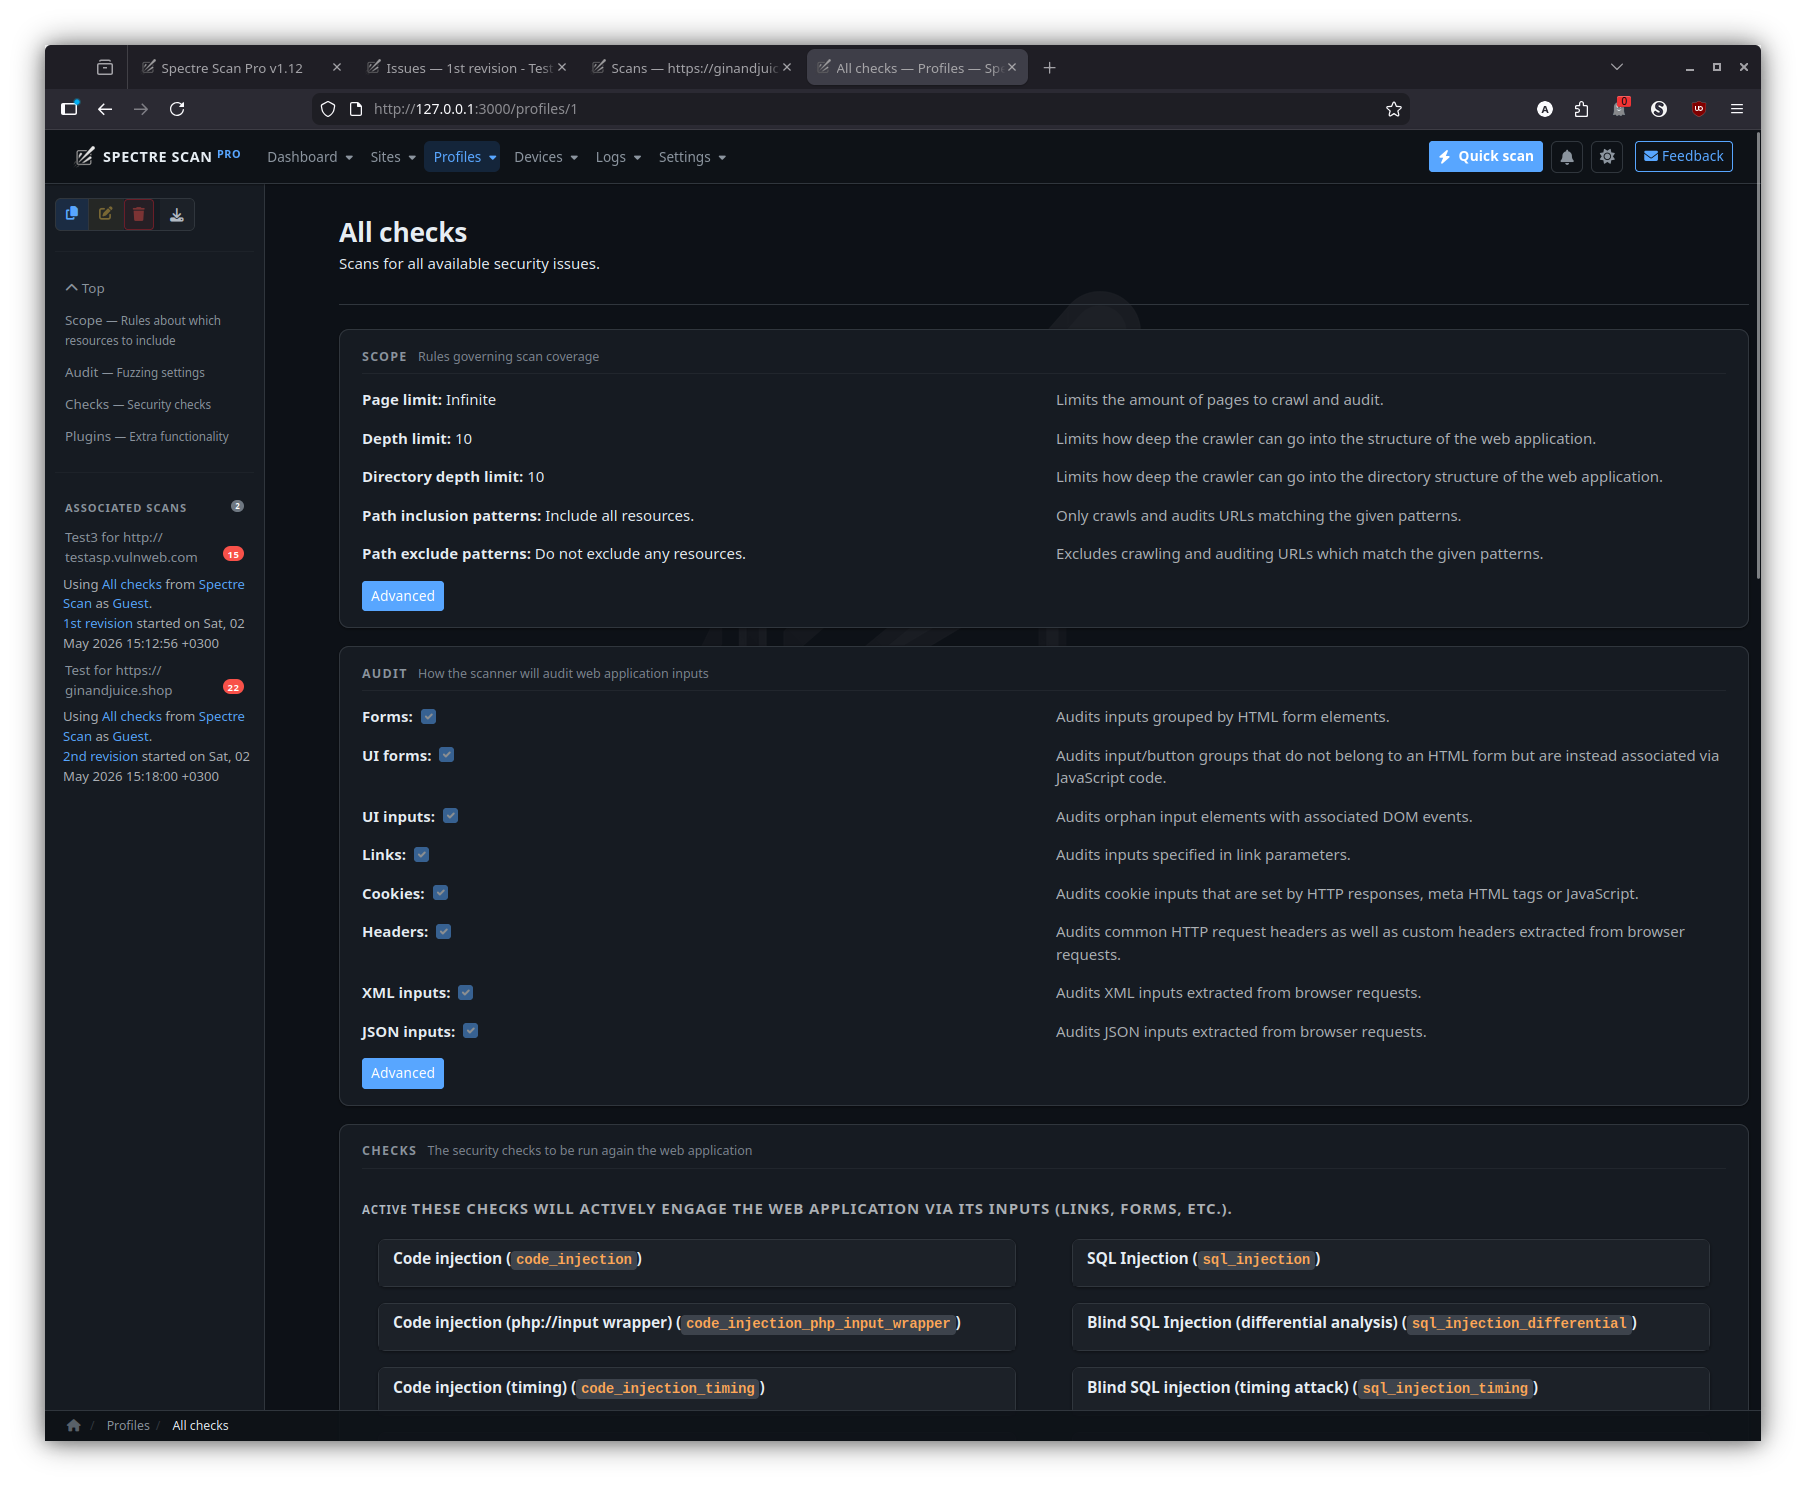
Profile editor — checks
Pick exactly which checks should run as part of a profile.
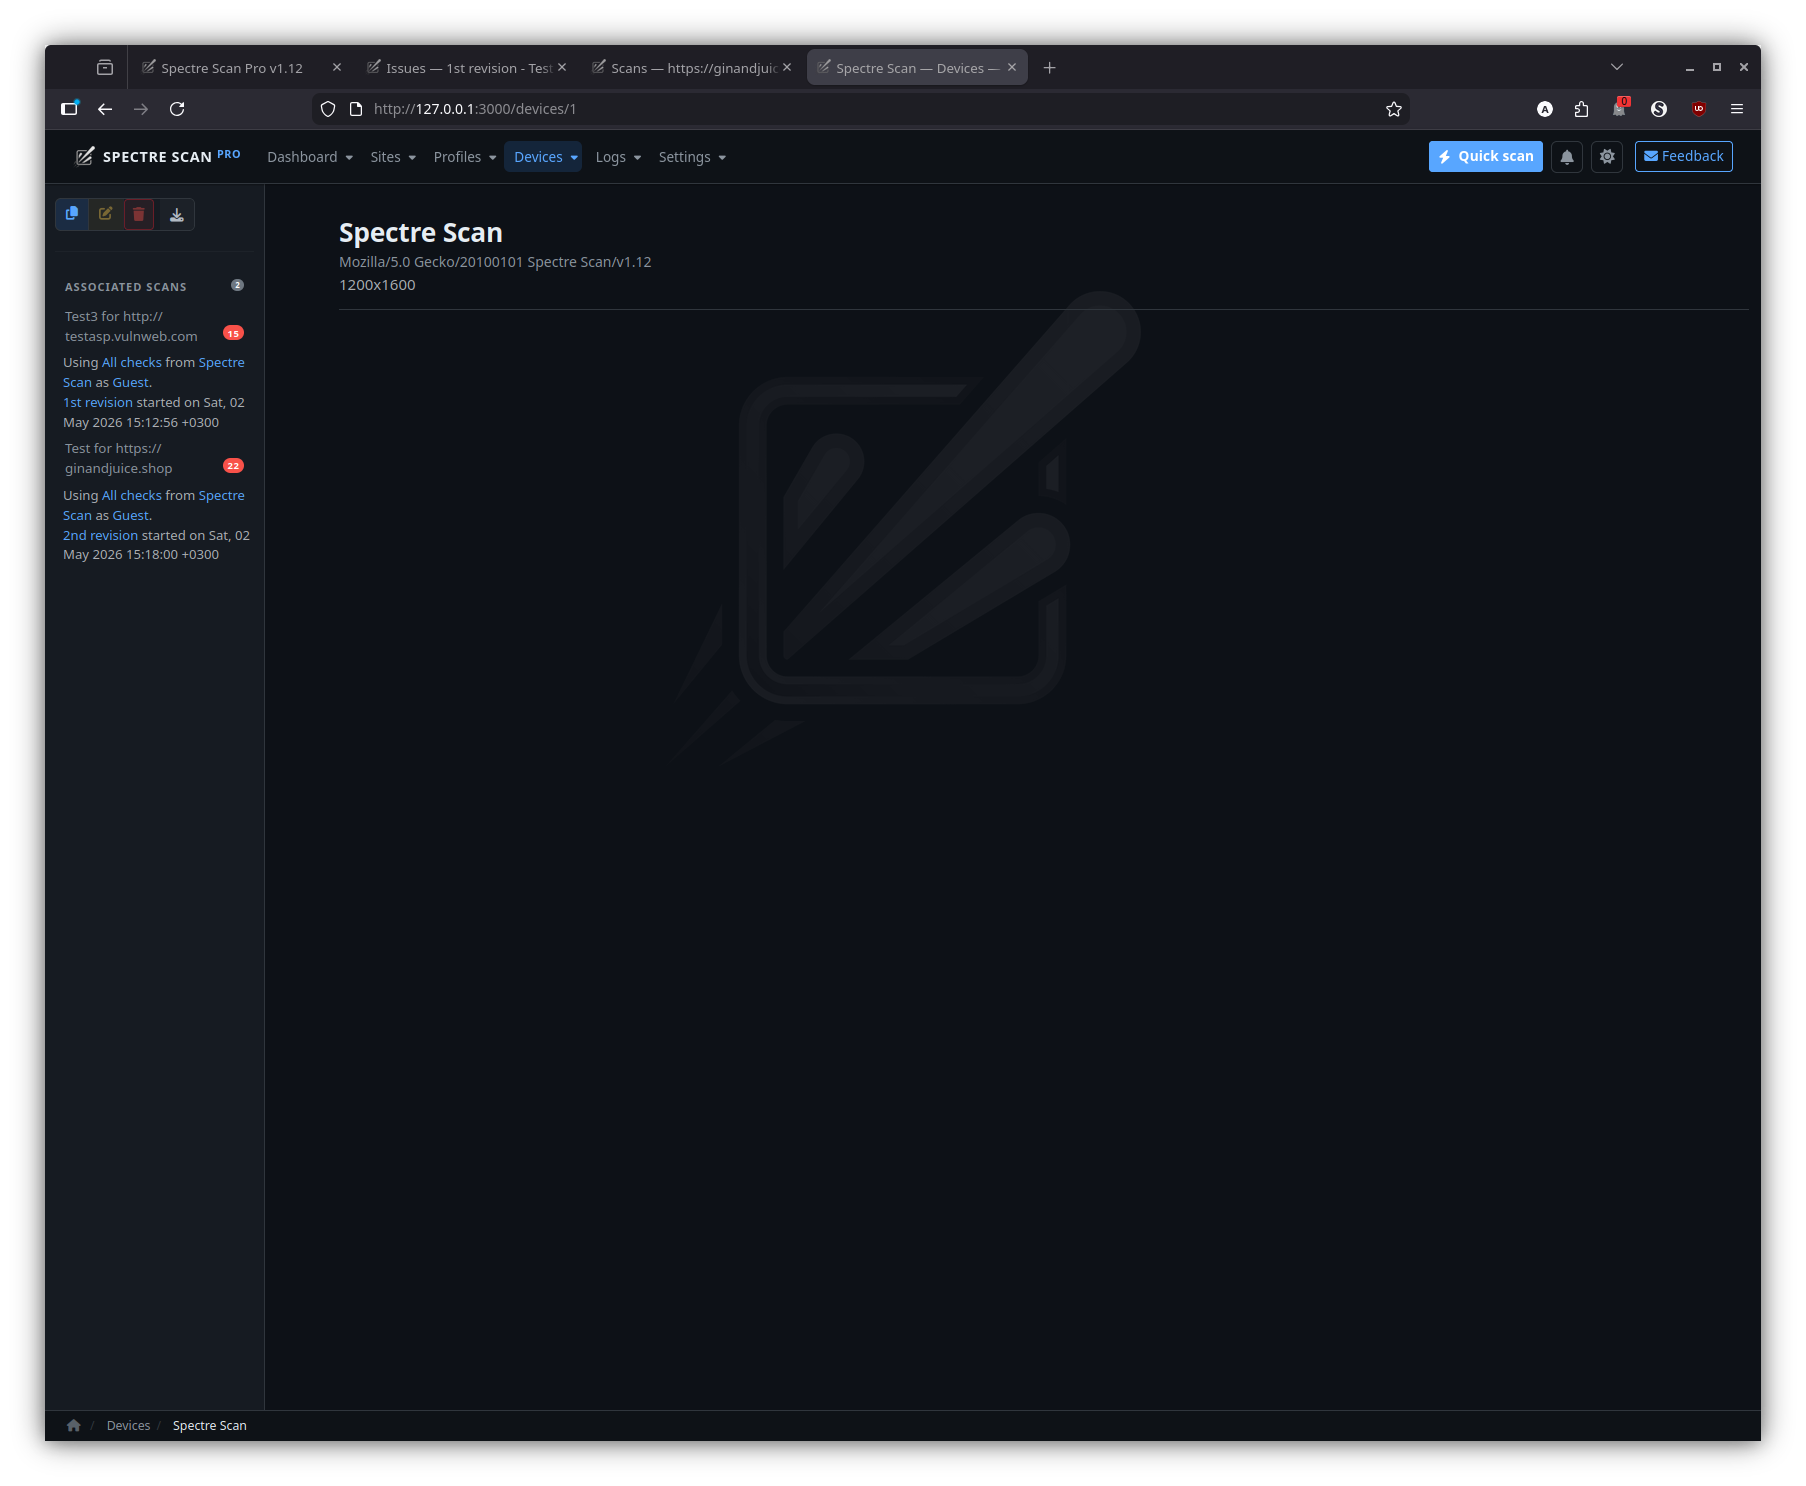
Devices
Device emulation lets you scan as a desktop browser, mobile, tablet, or any custom user-agent / viewport combination.
Settings
Top-level application settings: notifications, OpenAI integration, default scan / HTTP / browser-pool tuning.
Export
Export scan results in any of the supported report formats (HTML, JSON, XML, plain-text, AFR archive).
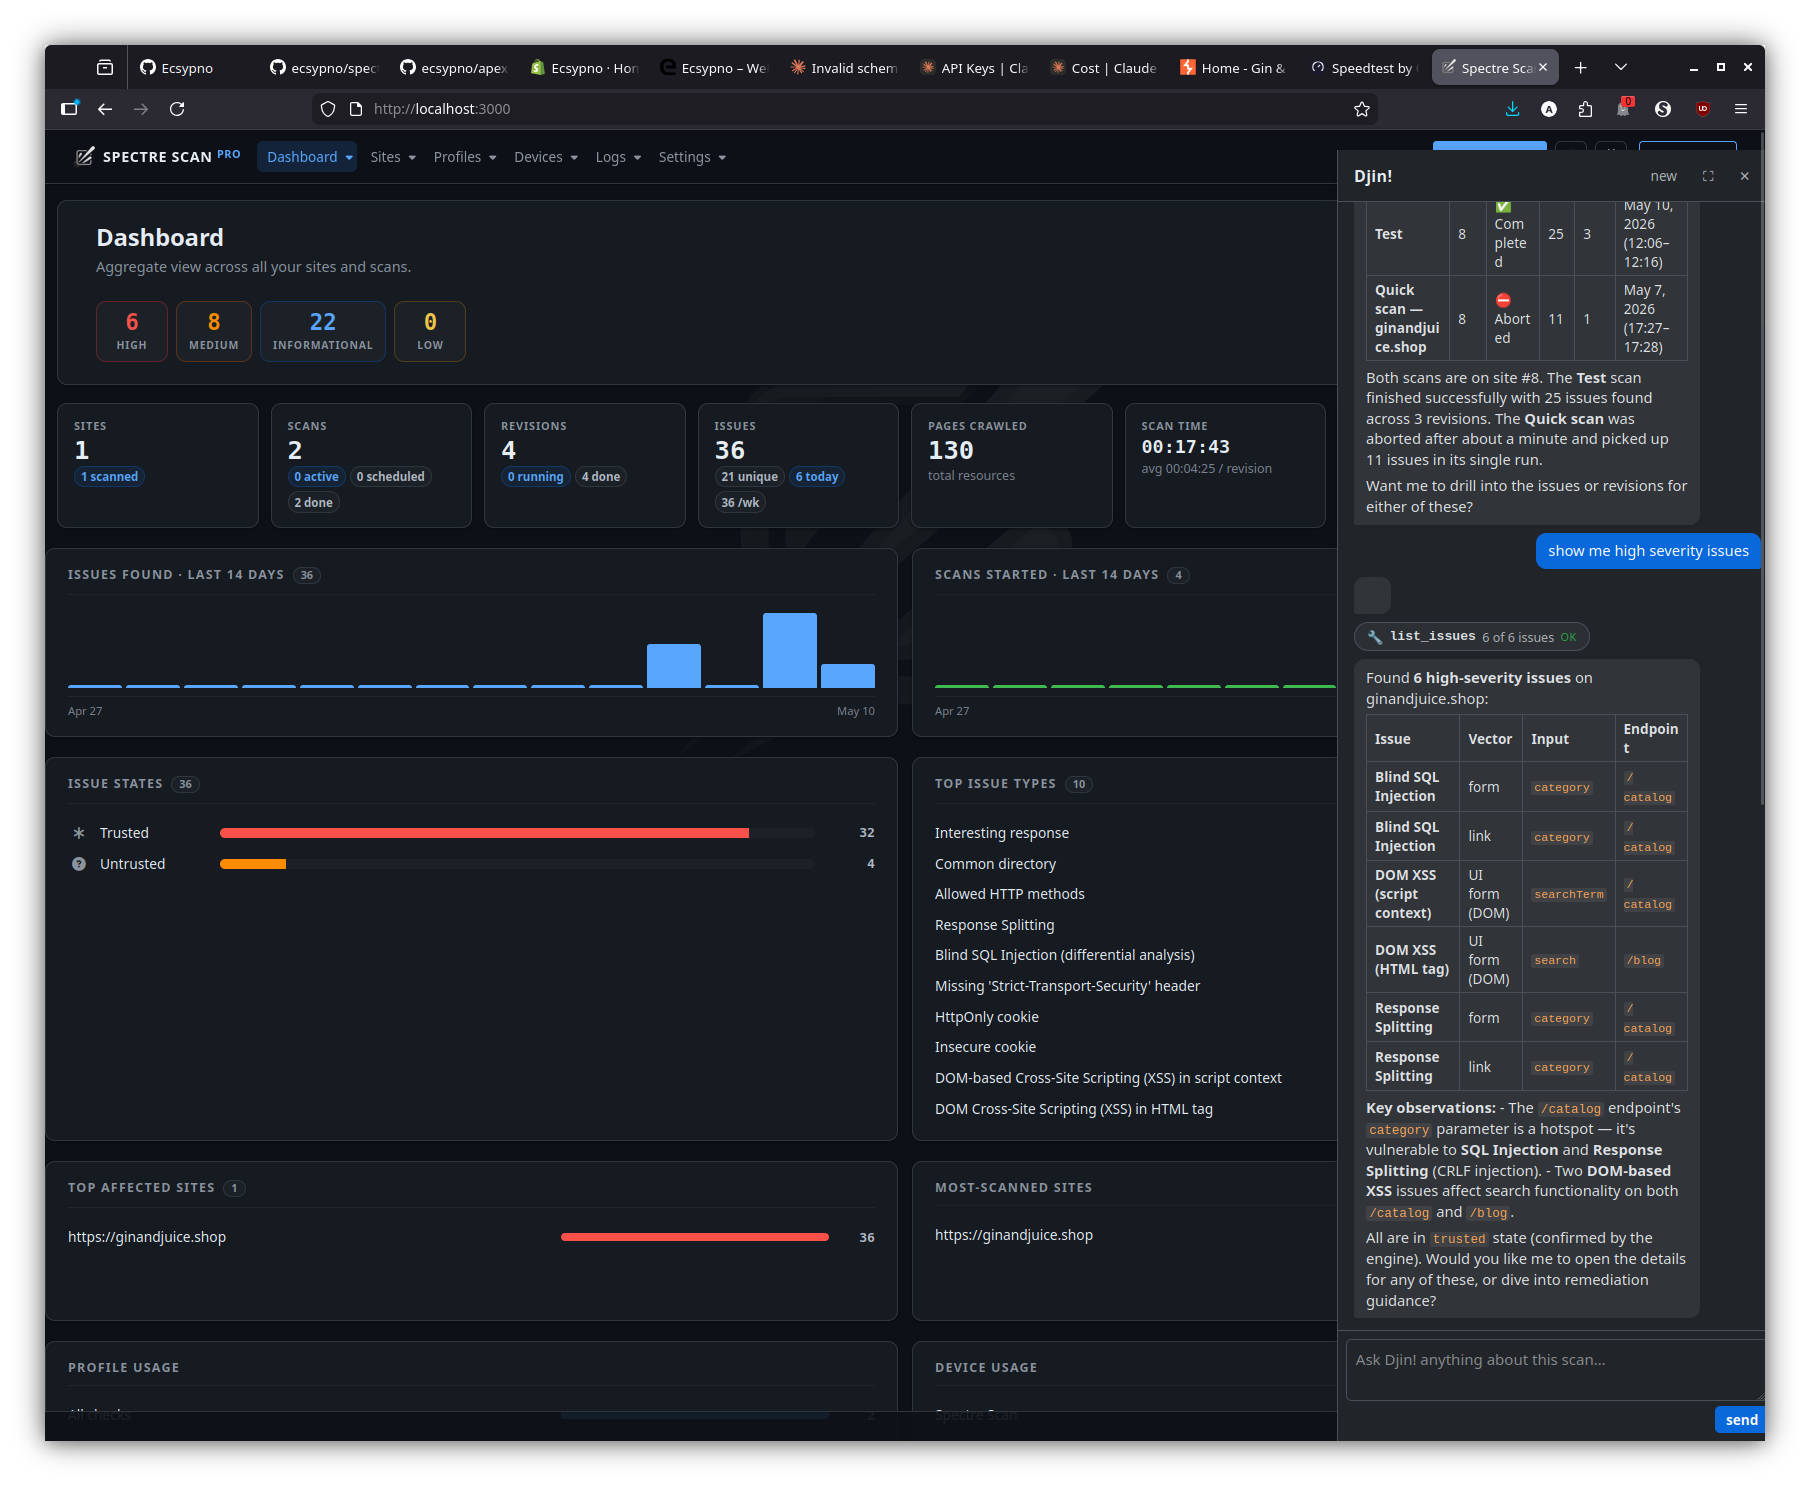
Djin! — AI assistant
Side-dock chat that streams via Action Cable, with page-aware grounding, scoped read tools and approval-gated write tools.
Page-aware answers — dashboard
Dock open against the dashboard; “show me high-severity issues” is grounded against the records you actually own, not a free-form recap.
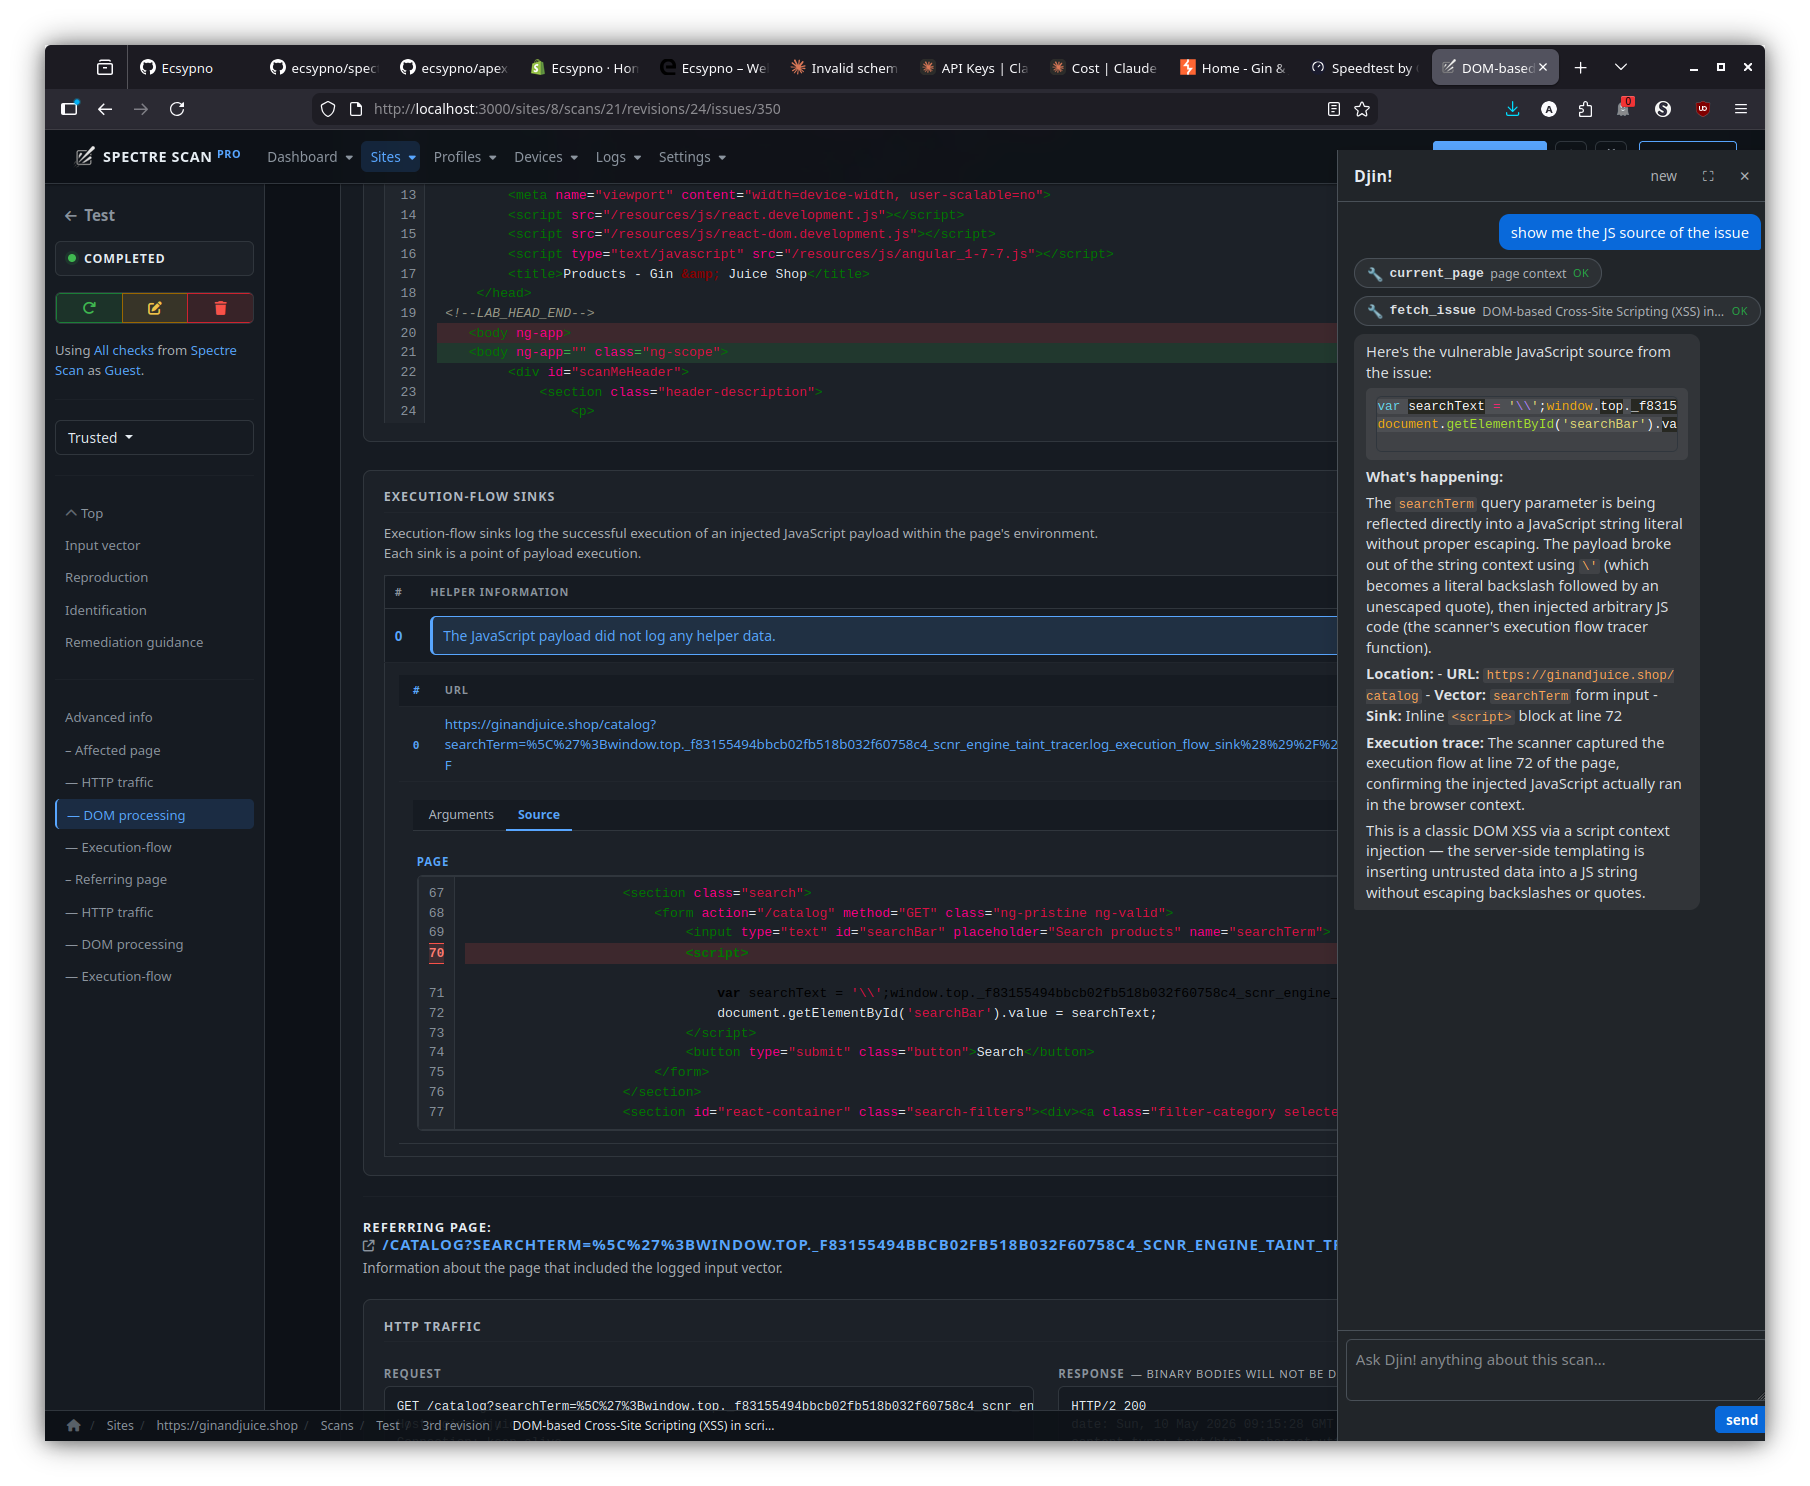
Page-aware answers — issue detail
On an issue page, the dock explains the finding and walks the execution flow against the captured request / response in front of you.
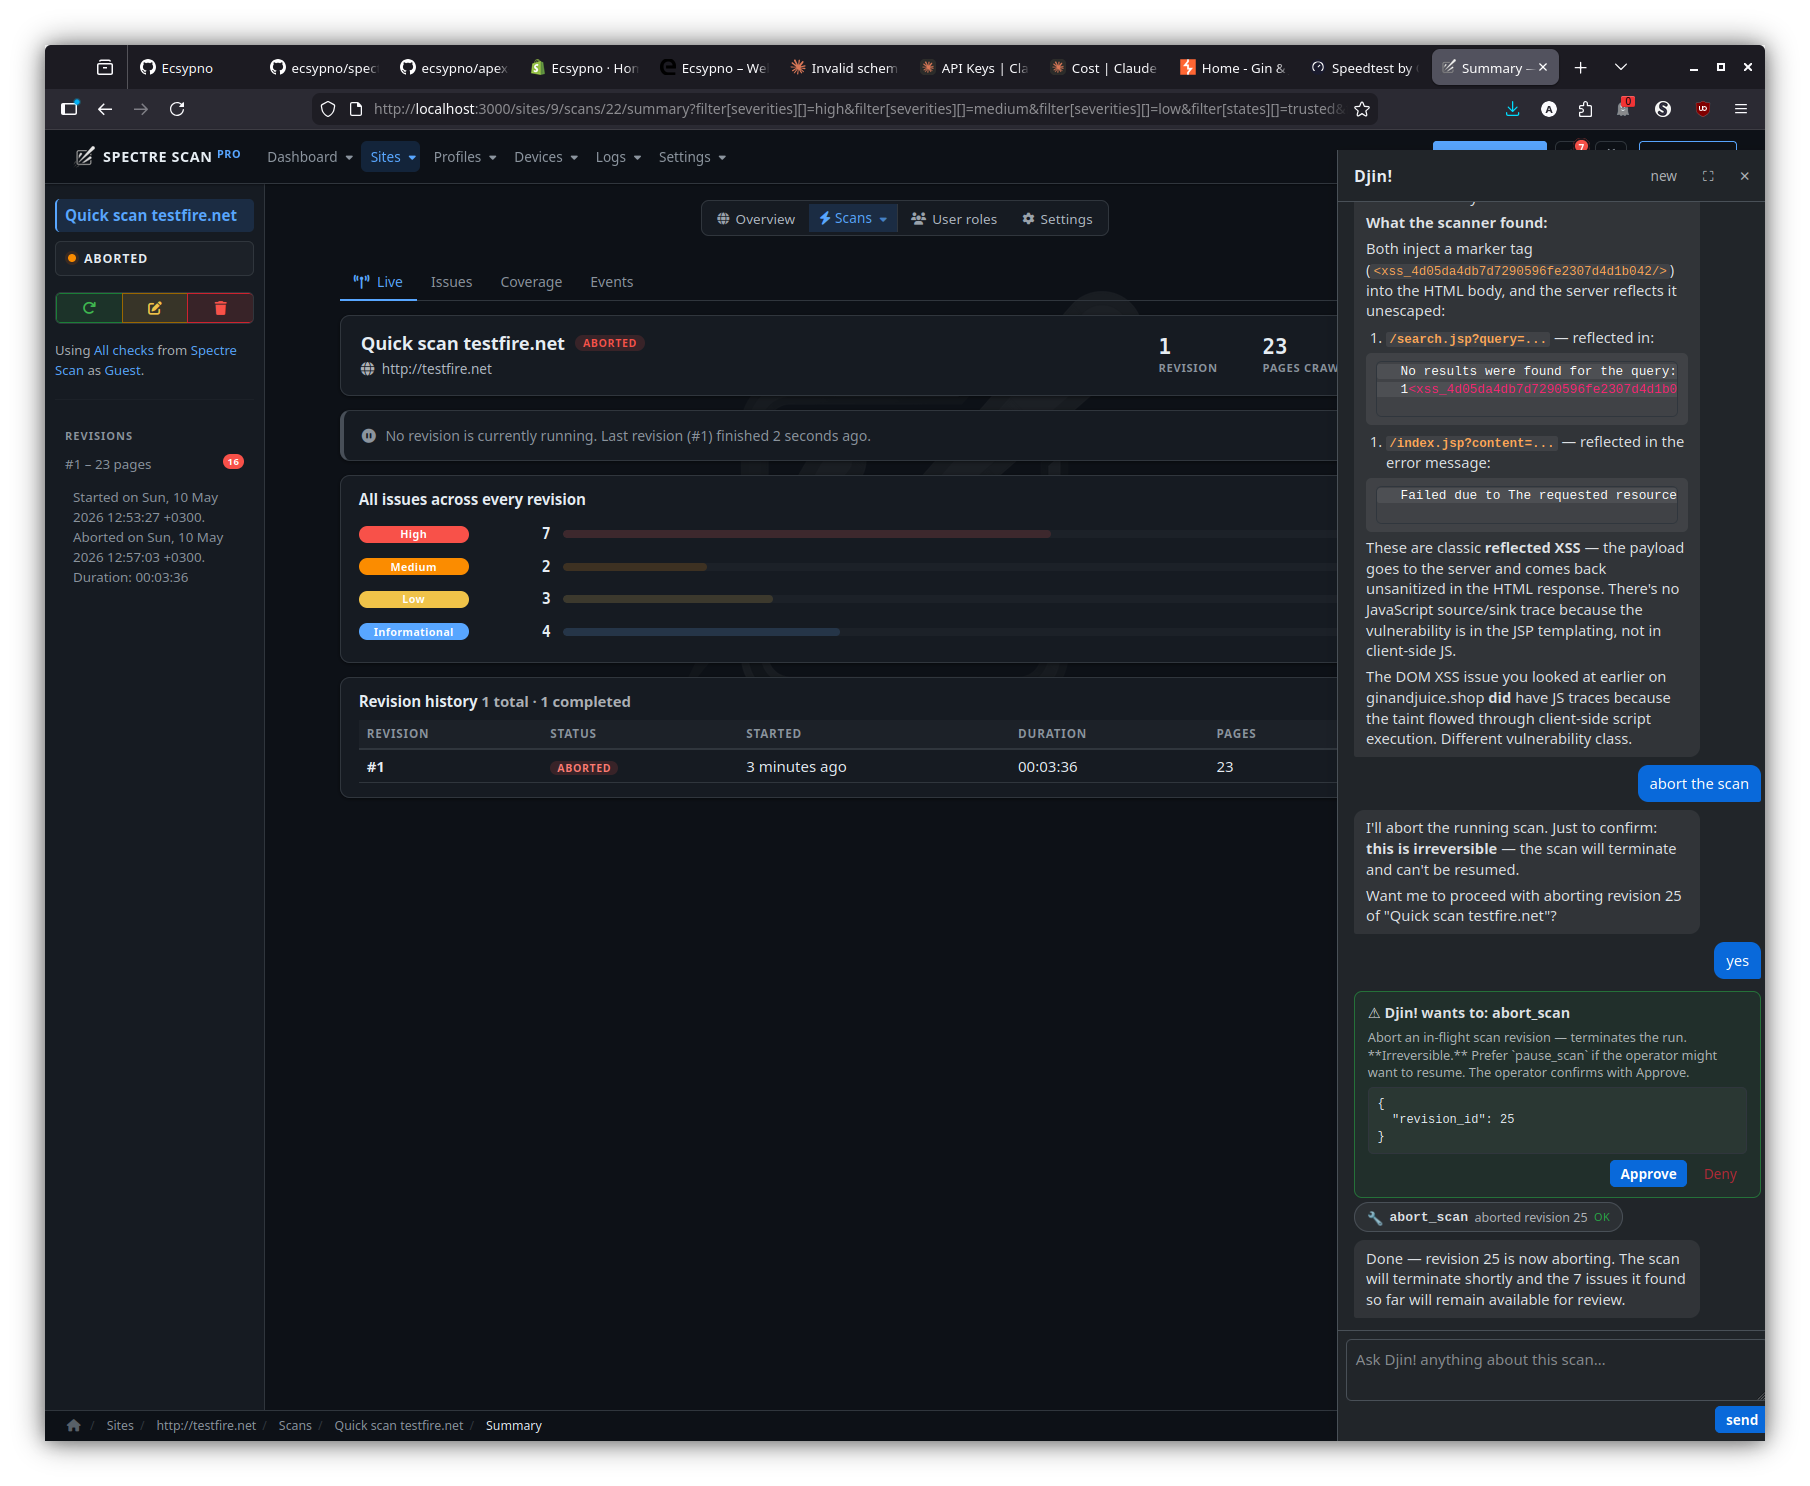
Approval-gated write tools
Write tools (here: abort_scan) propose their args inline as a
yellow card. Nothing happens until you click Approve; deny
to send the rejection reason back to the model.